Maxwell Playoff Projections: Round Two
Below are the current Maxwell Ratings' playoff projections for each class.
The Maxwell Ratings playoff projections are based on a Markov Chain analysis of the 2015 playoffs. The analysis represents 1,000,000 iterations.
While the Maxwell Ratings reflect each team’s strength, the simulation highlights the impact of the season’s structure as defined by the games, region alignments, and playoff brackets.
Class AAAAAA
Modal Bracket
Although any specific bracket is highly unlikely, the modal bracket represents the most probable of all the possible brackets.

Playoff Projections by Team
Each team is shown with its region, rating, the number of times making it to the finals, and the number of times of winning the state championship along with the associated odds.
| Team | Seed | Record | Rating | Draw | Depth | Qtr | Semi | Finals | Champion | Odds |
|---|---|---|---|---|---|---|---|---|---|---|
| Grayson | R 8, #1 | 11-0 | 97.44 | 79.55 | 3.74 | 954,783 | 789,192 | 611,314 | 380,566 | 1.63 |
| Colquitt County | R 1, #1 | 11-0 | 93.88 | 78.71 | 3.65 | 939,460 | 895,098 | 535,034 | 275,983 | 2.62 |
| Mill Creek | R 7, #1 | 11-0 | 90.55 | 83.08 | 2.89 | 975,589 | 544,698 | 256,431 | 112,658 | 7.88 |
| Roswell | R 5, #1 | 11-0 | 88.20 | 82.06 | 2.81 | 752,688 | 700,503 | 252,938 | 101,031 | 8.90 |
| Archer | R 8, #2 | 10-1 | 92.53 | 86.61 | 2.36 | 724,920 | 373,534 | 177,277 | 85,917 | 10.64 |
| Peachtree Ridge | R 7, #2 | 8-3 | 84.47 | 84.38 | 2.25 | 928,707 | 200,214 | 94,124 | 29,739 | 32.63 |
| Camden County | R 1, #2 | 10-1 | 78.90 | 84.64 | 1.49 | 247,312 | 204,823 | 35,300 | 7,472 | 132.84 |
| McEachern | R 4, #1 | 10-1 | 81.01 | 88.67 | 1.38 | 275,080 | 80,933 | 22,698 | 5,578 | 178.28 |
| South Forsyth | R 6, #1 | 10-1 | 65.71 | 84.66 | 1.82 | 752,315 | 61,790 | 5,273 | 380 | 2,631.13 |
| Central Gwinnett | R 8, #3 | 7-4 | 68.29 | 86.34 | 1.10 | 60,540 | 34,597 | 2,994 | 270 | 3,700.25 |
| Valdosta | R 1, #3 | 8-3 | 68.77 | 87.45 | 1.06 | 45,217 | 8,556 | 1,544 | 141 | 7,091.25 |
| Collins Hill | R 7, #3 | 6-5 | 64.07 | 84.31 | 1.55 | 500,500 | 45,819 | 2,145 | 128 | 7,786.97 |
| Newton | R 2, #1 | 9-2 | 62.22 | 83.47 | 1.55 | 499,500 | 48,855 | 2,453 | 124 | 8,072.44 |
| Tucker | R 2, #2 | 8-3 | 56.43 | 85.21 | 1.26 | 247,685 | 8,516 | 257 | 8 | 126,031.50 |
| Westlake | R 3, #1 | 9-2 | 56.97 | 86.23 | 1.07 | 71,293 | 2,038 | 181 | 6 | 178,706.61 |
| Newnan | R 3, #2 | 9-2 | 55.50 | 88.37 | 1.03 | 24,411 | 835 | 36 | 1 | 991,261.21 |
Class AAAAA
Modal Bracket
Although any specific bracket is highly unlikely, the modal bracket represents the most probable of all the possible brackets.

Playoff Projections by Team
Each team is shown with its region, rating, the number of times making it to the finals, and the number of times of winning the state championship along with the associated odds.
| Team | Seed | Record | Rating | Draw | Depth | Qtr | Semi | Finals | Champion | Odds |
|---|---|---|---|---|---|---|---|---|---|---|
| Stockbridge | R 4, #1 | 11-0 | 73.29 | 58.78 | 3.39 | 918,490 | 666,821 | 497,816 | 311,402 | 2.21 |
| Northgate | R 4, #2 | 10-1 | 72.03 | 62.70 | 2.42 | 654,527 | 388,926 | 241,676 | 136,338 | 6.33 |
| Coffee | R 3, #1 | 10-1 | 68.41 | 62.53 | 2.64 | 847,096 | 431,876 | 245,816 | 117,701 | 7.50 |
| Ware County | R 3, #3 | 9-2 | 67.86 | 64.69 | 2.65 | 770,653 | 551,711 | 218,516 | 108,156 | 8.25 |
| Houston County | R 2, #1 | 10-1 | 67.42 | 64.41 | 2.10 | 554,532 | 317,022 | 153,611 | 69,979 | 13.29 |
| Glynn Academy | R 3, #2 | 9-2 | 67.23 | 64.77 | 2.07 | 634,599 | 225,353 | 139,266 | 66,779 | 13.97 |
| Mays | R 6, #2 | 10-1 | 67.06 | 65.21 | 1.84 | 445,468 | 240,781 | 103,912 | 46,464 | 20.52 |
| Starr's Mill | R 4, #3 | 10-1 | 66.51 | 64.63 | 1.86 | 507,499 | 221,204 | 88,838 | 38,589 | 24.91 |
| Allatoona | R 5, #1 | 10-1 | 64.38 | 63.78 | 1.84 | 492,501 | 220,993 | 90,910 | 35,079 | 27.51 |
| Lanier | R 8, #1 | 11-0 | 63.81 | 65.46 | 1.60 | 345,473 | 154,329 | 70,252 | 26,220 | 37.14 |
| Drew | R 4, #4 | 8-3 | 60.95 | 63.60 | 1.85 | 575,176 | 207,505 | 52,859 | 17,554 | 55.97 |
| Dalton | R 7, #1 | 9-2 | 59.88 | 64.16 | 1.51 | 365,401 | 91,828 | 41,421 | 12,807 | 77.08 |
| South Paulding | R 5, #2 | 9-2 | 56.09 | 63.21 | 1.59 | 424,824 | 138,005 | 25,613 | 6,034 | 164.72 |
| Rome | R 7, #4 | 8-3 | 57.57 | 66.11 | 1.36 | 229,347 | 102,779 | 20,451 | 5,376 | 185.03 |
| Kell | R 7, #2 | 8-3 | 53.12 | 66.07 | 1.18 | 152,904 | 24,869 | 4,986 | 888 | 1,124.56 |
| Gainesville | R 8, #2 | 8-3 | 50.90 | 64.92 | 1.10 | 81,510 | 15,998 | 4,057 | 632 | 1,580.09 |
Class AAAA
Modal Bracket
Although any specific bracket is highly unlikely, the modal bracket represents the most probable of all the possible brackets.

Playoff Projections by Team
Each team is shown with its region, rating, the number of times making it to the finals, and the number of times of winning the state championship along with the associated odds.
| Team | Seed | Record | Rating | Draw | Depth | Qtr | Semi | Finals | Champion | Odds |
|---|---|---|---|---|---|---|---|---|---|---|
| Woodward Academy | R 5, #1 | 11-0 | 71.22 | 55.20 | 3.38 | 856,559 | 685,645 | 503,240 | 339,453 | 1.95 |
| Cartersville | R 7, #1 | 11-0 | 66.34 | 55.45 | 3.01 | 816,678 | 622,536 | 380,151 | 192,754 | 4.19 |
| Bainbridge | R 1, #1 | 11-0 | 66.14 | 57.83 | 2.64 | 646,571 | 525,566 | 311,989 | 156,746 | 5.38 |
| Buford | R 8, #1 | 10-1 | 63.73 | 57.50 | 2.42 | 702,033 | 437,005 | 186,148 | 93,582 | 9.69 |
| Thomson | R 3, #1 | 10-1 | 59.80 | 57.23 | 2.57 | 927,842 | 432,241 | 148,389 | 60,907 | 15.42 |
| Sandy Creek | R 5, #2 | 9-2 | 61.93 | 59.28 | 1.76 | 353,429 | 248,941 | 113,799 | 46,205 | 20.64 |
| Mary Persons | R 2, #1 | 11-0 | 59.42 | 59.04 | 2.12 | 750,635 | 220,821 | 102,639 | 41,238 | 23.25 |
| Jonesboro | R 4, #1 | 10-1 | 56.86 | 58.21 | 2.11 | 727,307 | 250,316 | 98,851 | 29,561 | 32.83 |
| Worth County | R 1, #3 | 8-3 | 56.99 | 61.42 | 1.47 | 297,967 | 125,860 | 32,154 | 11,189 | 88.38 |
| St. Pius X | R 6, #1 | 9-2 | 52.87 | 57.99 | 1.80 | 592,184 | 148,658 | 44,898 | 10,185 | 97.18 |
| Spalding | R 4, #3 | 10-1 | 55.18 | 61.75 | 1.23 | 143,441 | 58,633 | 19,029 | 5,903 | 168.41 |
| Liberty County | R 3, #2 | 8-3 | 53.23 | 60.61 | 1.29 | 183,322 | 81,387 | 23,036 | 5,364 | 185.42 |
| West Laurens | R 2, #2 | 8-3 | 50.97 | 60.24 | 1.51 | 407,816 | 76,834 | 18,216 | 3,587 | 277.81 |
| Marist | R 6, #2 | 9-2 | 50.23 | 60.49 | 1.29 | 249,365 | 34,901 | 8,171 | 1,794 | 556.38 |
| Carrollton | R 5, #3 | 6-5 | 48.88 | 59.67 | 1.33 | 272,693 | 45,761 | 9,060 | 1,516 | 658.51 |
| Grady | R 6, #3 | 7-4 | 36.09 | 60.16 | 1.08 | 72,158 | 4,893 | 228 | 15 | 65,282.74 |
Class AAA
Modal Bracket
Although any specific bracket is highly unlikely, the modal bracket represents the most probable of all the possible brackets.

Playoff Projections by Team
Each team is shown with its region, rating, the number of times making it to the finals, and the number of times of winning the state championship along with the associated odds.
| Team | Seed | Record | Rating | Draw | Depth | Qtr | Semi | Finals | Champion | Odds |
|---|---|---|---|---|---|---|---|---|---|---|
| Calhoun | R 6, #1 | 11-0 | 68.74 | 47.58 | 3.78 | 883,397 | 802,671 | 594,937 | 503,906 | 0.98 |
| Blessed Trinity | R 4, #1 | 10-0-1 | 62.03 | 50.91 | 2.82 | 721,718 | 623,204 | 270,036 | 200,888 | 3.98 |
| Cedar Grove | R 4, #2 | 9-1-1 | 56.36 | 47.87 | 2.91 | 754,174 | 603,045 | 418,119 | 133,112 | 6.51 |
| Jackson | R 2, #1 | 9-2 | 49.52 | 46.98 | 2.53 | 751,756 | 492,396 | 237,739 | 47,809 | 19.92 |
| Jefferson | R 8, #2 | 10-1 | 54.33 | 53.36 | 1.57 | 278,282 | 208,008 | 54,040 | 31,563 | 30.68 |
| Callaway | R 5, #1 | 10-1 | 45.42 | 49.44 | 2.19 | 711,360 | 331,244 | 129,093 | 19,067 | 51.45 |
| Westside (Macon) | R 2, #4 | 8-3 | 46.33 | 49.22 | 2.19 | 811,533 | 248,828 | 112,919 | 17,896 | 54.88 |
| Peach County | R 2, #2 | 9-2 | 50.32 | 54.49 | 1.22 | 116,603 | 68,497 | 21,903 | 10,757 | 91.96 |
| Spencer | R 2, #3 | 8-3 | 46.50 | 51.64 | 2.10 | 897,615 | 165,920 | 25,169 | 10,147 | 97.55 |
| Dodge County | R 1, #1 | 11-0 | 46.95 | 52.32 | 1.69 | 573,709 | 82,396 | 23,385 | 9,665 | 102.46 |
| Oconee County | R 8, #1 | 9-2 | 43.32 | 49.53 | 1.44 | 245,826 | 131,919 | 57,162 | 7,147 | 138.92 |
| Elbert County | R 8, #3 | 9-2 | 45.81 | 54.53 | 1.49 | 426,291 | 46,436 | 10,457 | 4,055 | 245.63 |
| Adairsville | R 6, #2 | 10-1 | 40.27 | 49.88 | 1.38 | 248,244 | 101,347 | 26,525 | 2,579 | 386.68 |
| Westminster (Atlanta) | R 4, #3 | 7-4 | 38.23 | 50.43 | 1.38 | 288,640 | 75,014 | 16,059 | 1,313 | 760.83 |
| Sonoraville | R 6, #3 | 8-3 | 29.90 | 49.94 | 1.21 | 188,467 | 16,208 | 2,384 | 92 | 10,834.38 |
| Dawson County | R 7, #1 | 8-3 | 22.96 | 52.19 | 1.11 | 102,385 | 2,868 | 72 | 5 | 209,630.10 |
Class AA
Modal Bracket
Although any specific bracket is highly unlikely, the modal bracket represents the most probable of all the possible brackets.

Playoff Projections by Team
Each team is shown with its region, rating, the number of times making it to the finals, and the number of times of winning the state championship along with the associated odds.
| Team | Seed | Record | Rating | Draw | Depth | Qtr | Semi | Finals | Champion | Odds |
|---|---|---|---|---|---|---|---|---|---|---|
| Benedictine | R 2, #1 | 11-0 | 67.52 | 46.41 | 3.85 | 942,622 | 745,162 | 670,140 | 488,060 | 1.05 |
| Greater Atlanta Christian | R 6, #1 | 10-1 | 61.69 | 46.38 | 3.46 | 936,195 | 663,185 | 583,317 | 276,548 | 2.62 |
| Fitzgerald | R 1, #2 | 10-1 | 57.39 | 50.89 | 2.38 | 882,674 | 235,346 | 174,511 | 89,650 | 10.15 |
| Brooks County | R 1, #1 | 9-2 | 53.67 | 48.06 | 2.58 | 935,716 | 323,038 | 247,674 | 77,063 | 11.98 |
| Jefferson County | R 3, #1 | 9-2 | 47.09 | 50.24 | 1.98 | 581,029 | 323,441 | 54,977 | 16,336 | 60.22 |
| Rabun County | R 8, #1 | 10-1 | 46.63 | 49.96 | 2.01 | 619,399 | 323,673 | 53,120 | 15,336 | 64.21 |
| Macon County | R 4, #1 | 9-2 | 42.57 | 47.74 | 2.47 | 894,731 | 480,457 | 84,238 | 12,450 | 79.32 |
| Pace Academy | R 6, #4 | 9-2 | 44.44 | 50.49 | 1.89 | 536,933 | 290,235 | 50,895 | 8,634 | 114.82 |
| Wesleyan | R 6, #3 | 9-2 | 45.65 | 52.17 | 1.65 | 418,971 | 199,557 | 24,702 | 6,699 | 148.27 |
| Screven County | R 3, #2 | 10-1 | 41.13 | 49.56 | 1.71 | 463,067 | 216,504 | 29,186 | 3,866 | 257.65 |
| Early County | R 1, #3 | 7-3-1 | 43.59 | 52.44 | 1.55 | 380,601 | 153,328 | 16,006 | 3,786 | 263.10 |
| Lovett | R 6, #2 | 6-5 | 41.36 | 54.69 | 1.08 | 57,378 | 12,541 | 4,674 | 946 | 1,055.59 |
| Vidalia | R 2, #2 | 8-3 | 36.66 | 53.22 | 1.08 | 63,805 | 10,701 | 3,744 | 347 | 2,880.72 |
| Heard County | R 5, #1 | 8-3 | 35.38 | 53.70 | 1.13 | 117,326 | 6,951 | 1,869 | 240 | 4,158.81 |
| Manchester | R 5, #2 | 8-3 | 28.72 | 52.79 | 1.07 | 64,284 | 3,076 | 609 | 28 | 35,264.52 |
| Bowdon | R 5, #3 | 6-5 | 23.00 | 50.01 | 1.12 | 105,269 | 12,804 | 336 | 9 | 108,383.76 |
Class A - Public
Modal Bracket
Although any specific bracket is highly unlikely, the modal bracket represents the most probable of all the possible brackets.

Playoff Projections by Team
Each team is shown with its region, rating, the number of times making it to the finals, and the number of times of winning the state championship along with the associated odds.
| Team | Seed | Record | Rating | Draw | Depth | Qtr | Semi | Finals | Champion | Odds |
|---|---|---|---|---|---|---|---|---|---|---|
| Clinch County | 5 | 9-1 | 50.24 | 32.34 | 3.00 | 940,476 | 906,984 | 684,487 | 468,884 | 1.13 |
| Irwin County | 3 | 7-2-1 | 44.67 | 36.80 | 2.19 | 947,350 | 616,025 | 425,744 | 204,881 | 3.88 |
| Emanuel County Institute | 2 | 9-1 | 38.55 | 36.87 | 1.85 | 866,111 | 625,472 | 269,837 | 92,452 | 9.82 |
| Turner County | 6 | 8-2 | 42.32 | 40.26 | 1.40 | 778,682 | 330,081 | 211,483 | 78,774 | 11.69 |
| Charlton County | 8 | 7-2 | 41.75 | 40.70 | 1.42 | 762,240 | 444,492 | 143,055 | 67,016 | 13.92 |
| Marion County | 1 | 9-1 | 37.72 | 38.22 | 1.60 | 923,650 | 463,180 | 145,939 | 66,881 | 13.95 |
| Lincoln County | 7 | 9-1 | 32.40 | 39.99 | 0.98 | 667,078 | 242,609 | 55,968 | 10,911 | 90.65 |
| Commerce | 9 | 7-3 | 31.93 | 43.15 | 0.34 | 237,760 | 84,851 | 15,139 | 3,894 | 255.78 |
| Trion | 11 | 7-3 | 27.91 | 41.54 | 0.29 | 221,318 | 47,452 | 17,475 | 2,906 | 343.14 |
| Mount Zion (Carroll) | 10 | 7-3 | 23.62 | 39.44 | 0.44 | 332,922 | 87,677 | 13,627 | 1,666 | 599.19 |
| Dooly County | 12 | 7-3 | 20.81 | 39.60 | 0.11 | 59,524 | 40,139 | 5,945 | 810 | 1,233.63 |
| Telfair County | 15 | 5-5 | 21.71 | 40.62 | 0.18 | 133,889 | 44,242 | 4,853 | 432 | 2,315.28 |
| Johnson County | 13 | 6-4 | 16.48 | 39.01 | 0.66 | 619,399 | 35,899 | 3,682 | 314 | 3,181.08 |
| Randolph-Clay | 4 | 7-3 | 13.44 | 39.36 | 0.40 | 380,601 | 16,979 | 1,332 | 83 | 12,103.30 |
| Wilkinson County | 14 | 6-4 | 17.60 | 42.05 | 0.06 | 52,650 | 6,442 | 1,013 | 68 | 14,732.52 |
| Twiggs County | 16 | 4-6 | 14.62 | 42.34 | 0.08 | 76,350 | 7,477 | 421 | 28 | 35,877.01 |
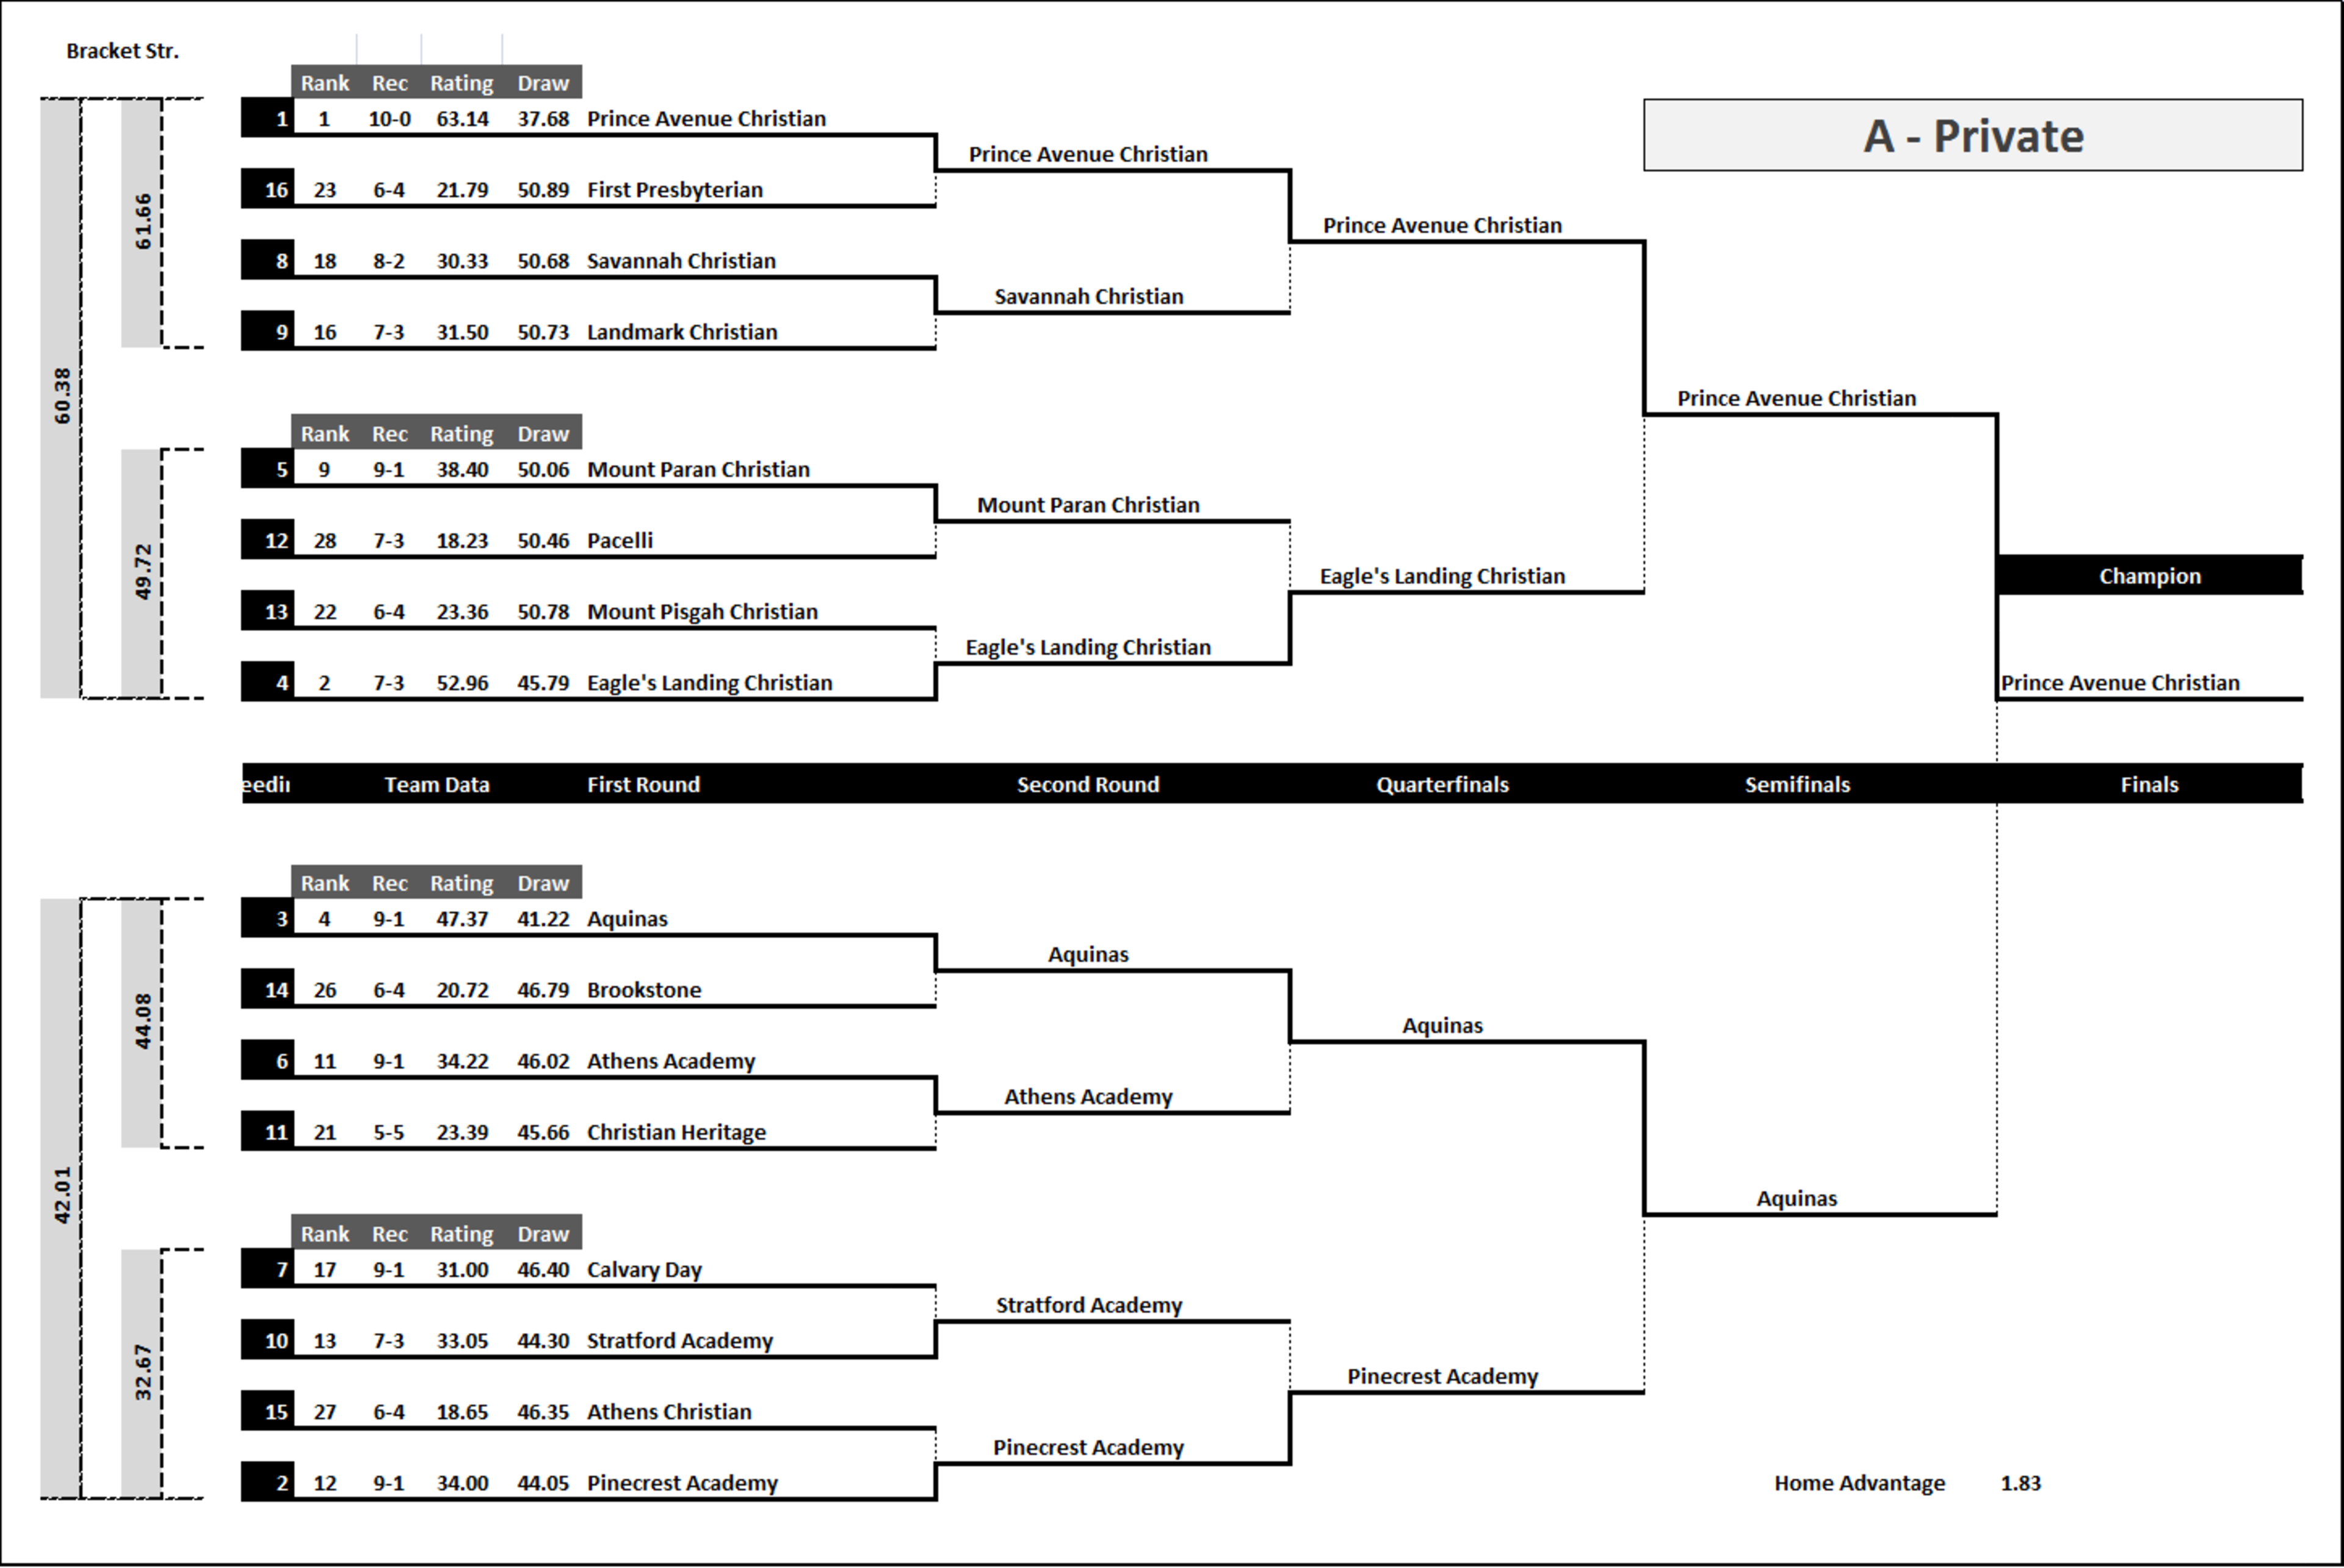
Class A - Private
Modal Bracket
Although any specific bracket is highly unlikely, the modal bracket represents the most probable of all the possible brackets.
Playoff Projections by Team
Each team is shown with its region, rating, the number of times making it to the finals, and the number of times of winning the state championship along with the associated odds.
| Team | Seed | Record | Rating | Draw | Depth | Qtr | Semi | Finals | Champion | Odds |
|---|---|---|---|---|---|---|---|---|---|---|
| Prince Avenue Christian | 1 | 10-0 | 63.14 | 37.68 | 3.39 | 986,849 | 955,157 | 766,305 | 682,943 | 0.46 |
| Eagle's Landing Christian | 4 | 7-3 | 52.96 | 45.79 | 2.10 | 941,420 | 804,774 | 211,009 | 146,837 | 5.81 |
| Aquinas | 3 | 9-1 | 47.37 | 41.22 | 2.50 | 945,215 | 795,537 | 628,213 | 135,759 | 6.37 |
| Pinecrest Academy | 2 | 9-1 | 34.00 | 44.05 | 1.45 | 847,871 | 453,425 | 141,269 | 10,818 | 91.44 |
| Stratford Academy | 10 | 7-3 | 33.05 | 44.30 | 1.04 | 595,801 | 339,390 | 100,537 | 8,373 | 118.43 |
| Mount Paran Christian | 5 | 9-1 | 38.40 | 50.06 | 1.06 | 862,238 | 171,858 | 16,395 | 6,348 | 156.53 |
| Athens Academy | 6 | 9-1 | 34.22 | 46.02 | 0.95 | 710,950 | 152,493 | 77,343 | 5,228 | 190.27 |
| Calvary Day | 7 | 9-1 | 31.00 | 46.40 | 0.62 | 404,199 | 176,332 | 35,711 | 1,819 | 548.85 |
| Landmark Christian | 9 | 7-3 | 31.50 | 50.73 | 0.51 | 483,506 | 20,591 | 2,845 | 703 | 1,421.87 |
| Savannah Christian | 8 | 8-2 | 30.33 | 50.68 | 0.54 | 516,494 | 19,966 | 2,520 | 575 | 1,739.38 |
| Christian Heritage | 11 | 5-5 | 23.39 | 45.66 | 0.34 | 289,050 | 36,557 | 10,912 | 354 | 2,822.64 |
| Brookstone | 14 | 6-4 | 20.72 | 46.79 | 0.07 | 54,785 | 15,412 | 3,385 | 74 | 13,446.77 |
| Mount Pisgah Christian | 13 | 6-4 | 23.36 | 50.78 | 0.07 | 58,580 | 15,335 | 488 | 74 | 13,516.99 |
| Athens Christian | 15 | 6-4 | 18.65 | 46.35 | 0.19 | 152,129 | 30,853 | 2,632 | 44 | 22,767.23 |
| First Presbyterian | 16 | 6-4 | 21.79 | 50.89 | 0.02 | 13,151 | 4,285 | 269 | 33 | 30,011.28 |
| Pacelli | 12 | 7-3 | 18.23 | 50.46 | 0.15 | 137,762 | 8,033 | 169 | 18 | 54,133.63 |