Metro Atlanta leaders left to make COVID-19 decisions with shaky data
The data behind Georgia’s count of COVID-19 cases and deaths is being gathered in the most suboptimal of scientific circumstances: real life.
But whether the data is perfect or not, and there are reasons to believe it is not perfect, metro Atlanta leaders are using those numbers to make decisions that affect everyone, like when city hall re-opens or which neighborhood gets extra testing today. The numbers aren't clean-cut or unimpeachable, but officials are going to war with the numbers they have.
“We are all in uncharted territory in COVID-19,” said Dr. Lynn Paxton, who came out of retirement a couple weeks ago to lead the Fulton County heath board after a career as an HIV researcher with international epidemic experience.
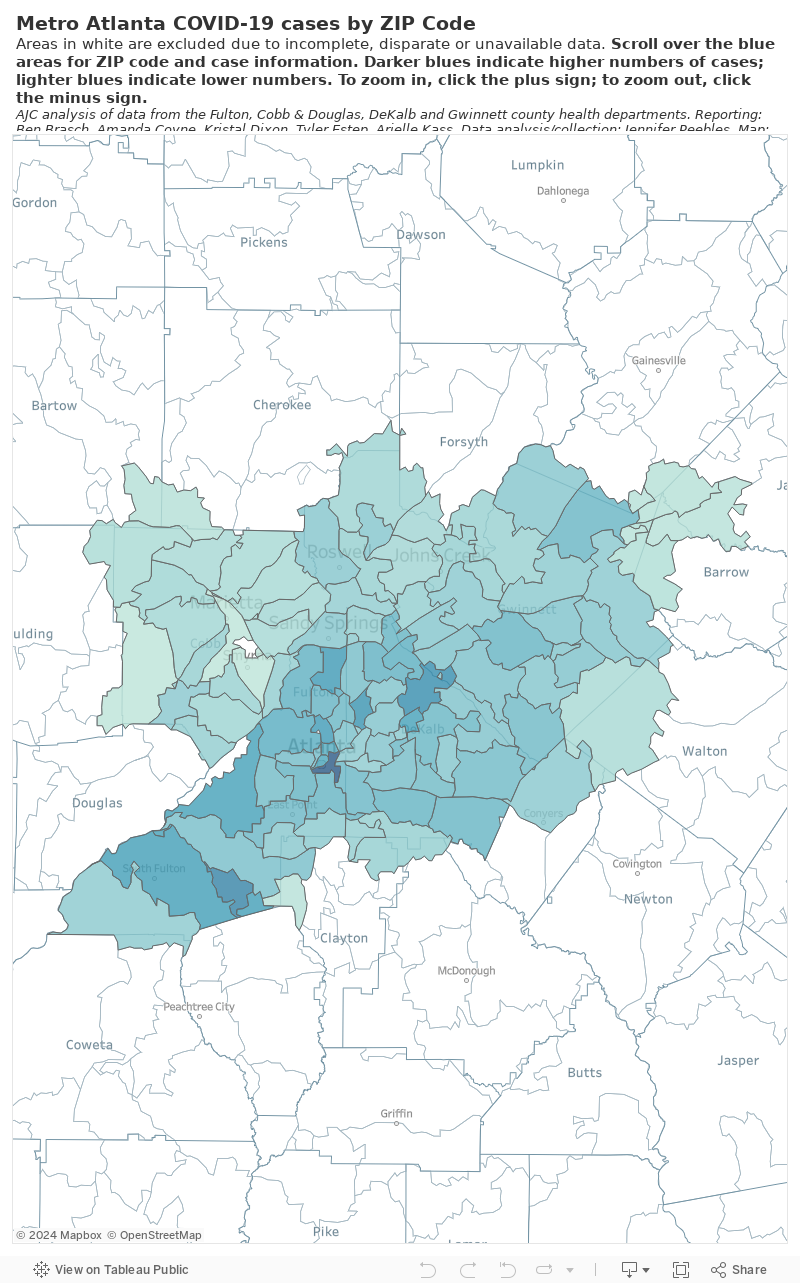
DATA | View interactive ZIP code map below
Doctors, testing agencies and public health officials have been tallying the case numbers using using a variety of metrics, including mapping where people with the virus live, to determine the best response to the outbreak.
Gwinnett health officials also look at rates of COVID-19 per 1,000 residents for each ZIP code in the county, a calculation that levels the playing field between densely populated neighborhoods and sparsely populated rural ones. Fulton County health officials, who meet daily to discuss the latest data, also use computer mapping to create “heat maps” showing where COVID patients’ homes are most heavily clustered.
The Atlanta Journal-Constitution acquired the number of cases by ZIP code from Cobb, DeKalb, Fulton and Gwinnett counties. All four are now providing updated case numbers daily or every other day for the public on their websites.
‘Unfortunate perfect storm’
Paxton said the first email she reads every day is a new summary of the case numbers.
Friday's figures show the ZIP code with highest total number of cases in Fulton is 30331, which sweeps along the western edge of the county from Camp Creek Parkway to I-20. The area includes two senior communities with outbreaks, Arbor Terrace at Cascade and Summerset Assisted Living Community.
The number of cases listed are based on test results collected from various sources: private testing entities like CVS and Walgreens, the city of Atlanta, Georgia's National Guard members and Fulton Board of Health. Fulton's board of health is the largest of the 18 public health districts in Georgia and is managed by the state health department not Fulton County government.
The state has been accused by lawmakers and statisticians of chronically mishandling and misrepresenting the case numbers, but public health officials have no other options to measure the outbreak in their counties. If the numbers are flawed or the reasoning unsound, the tireless efforts of medical professionals and $600 million of federal money already coming in to local metro governments won't matter as much.
Fulton County Manager Dick Anderson said officials with the county, board of health and emergency management meet every day at 4 p.m. to look at the numbers and identify “hotspots.” There’s no numerical benchmark for what makes a neighborhood a hotspot for cases.
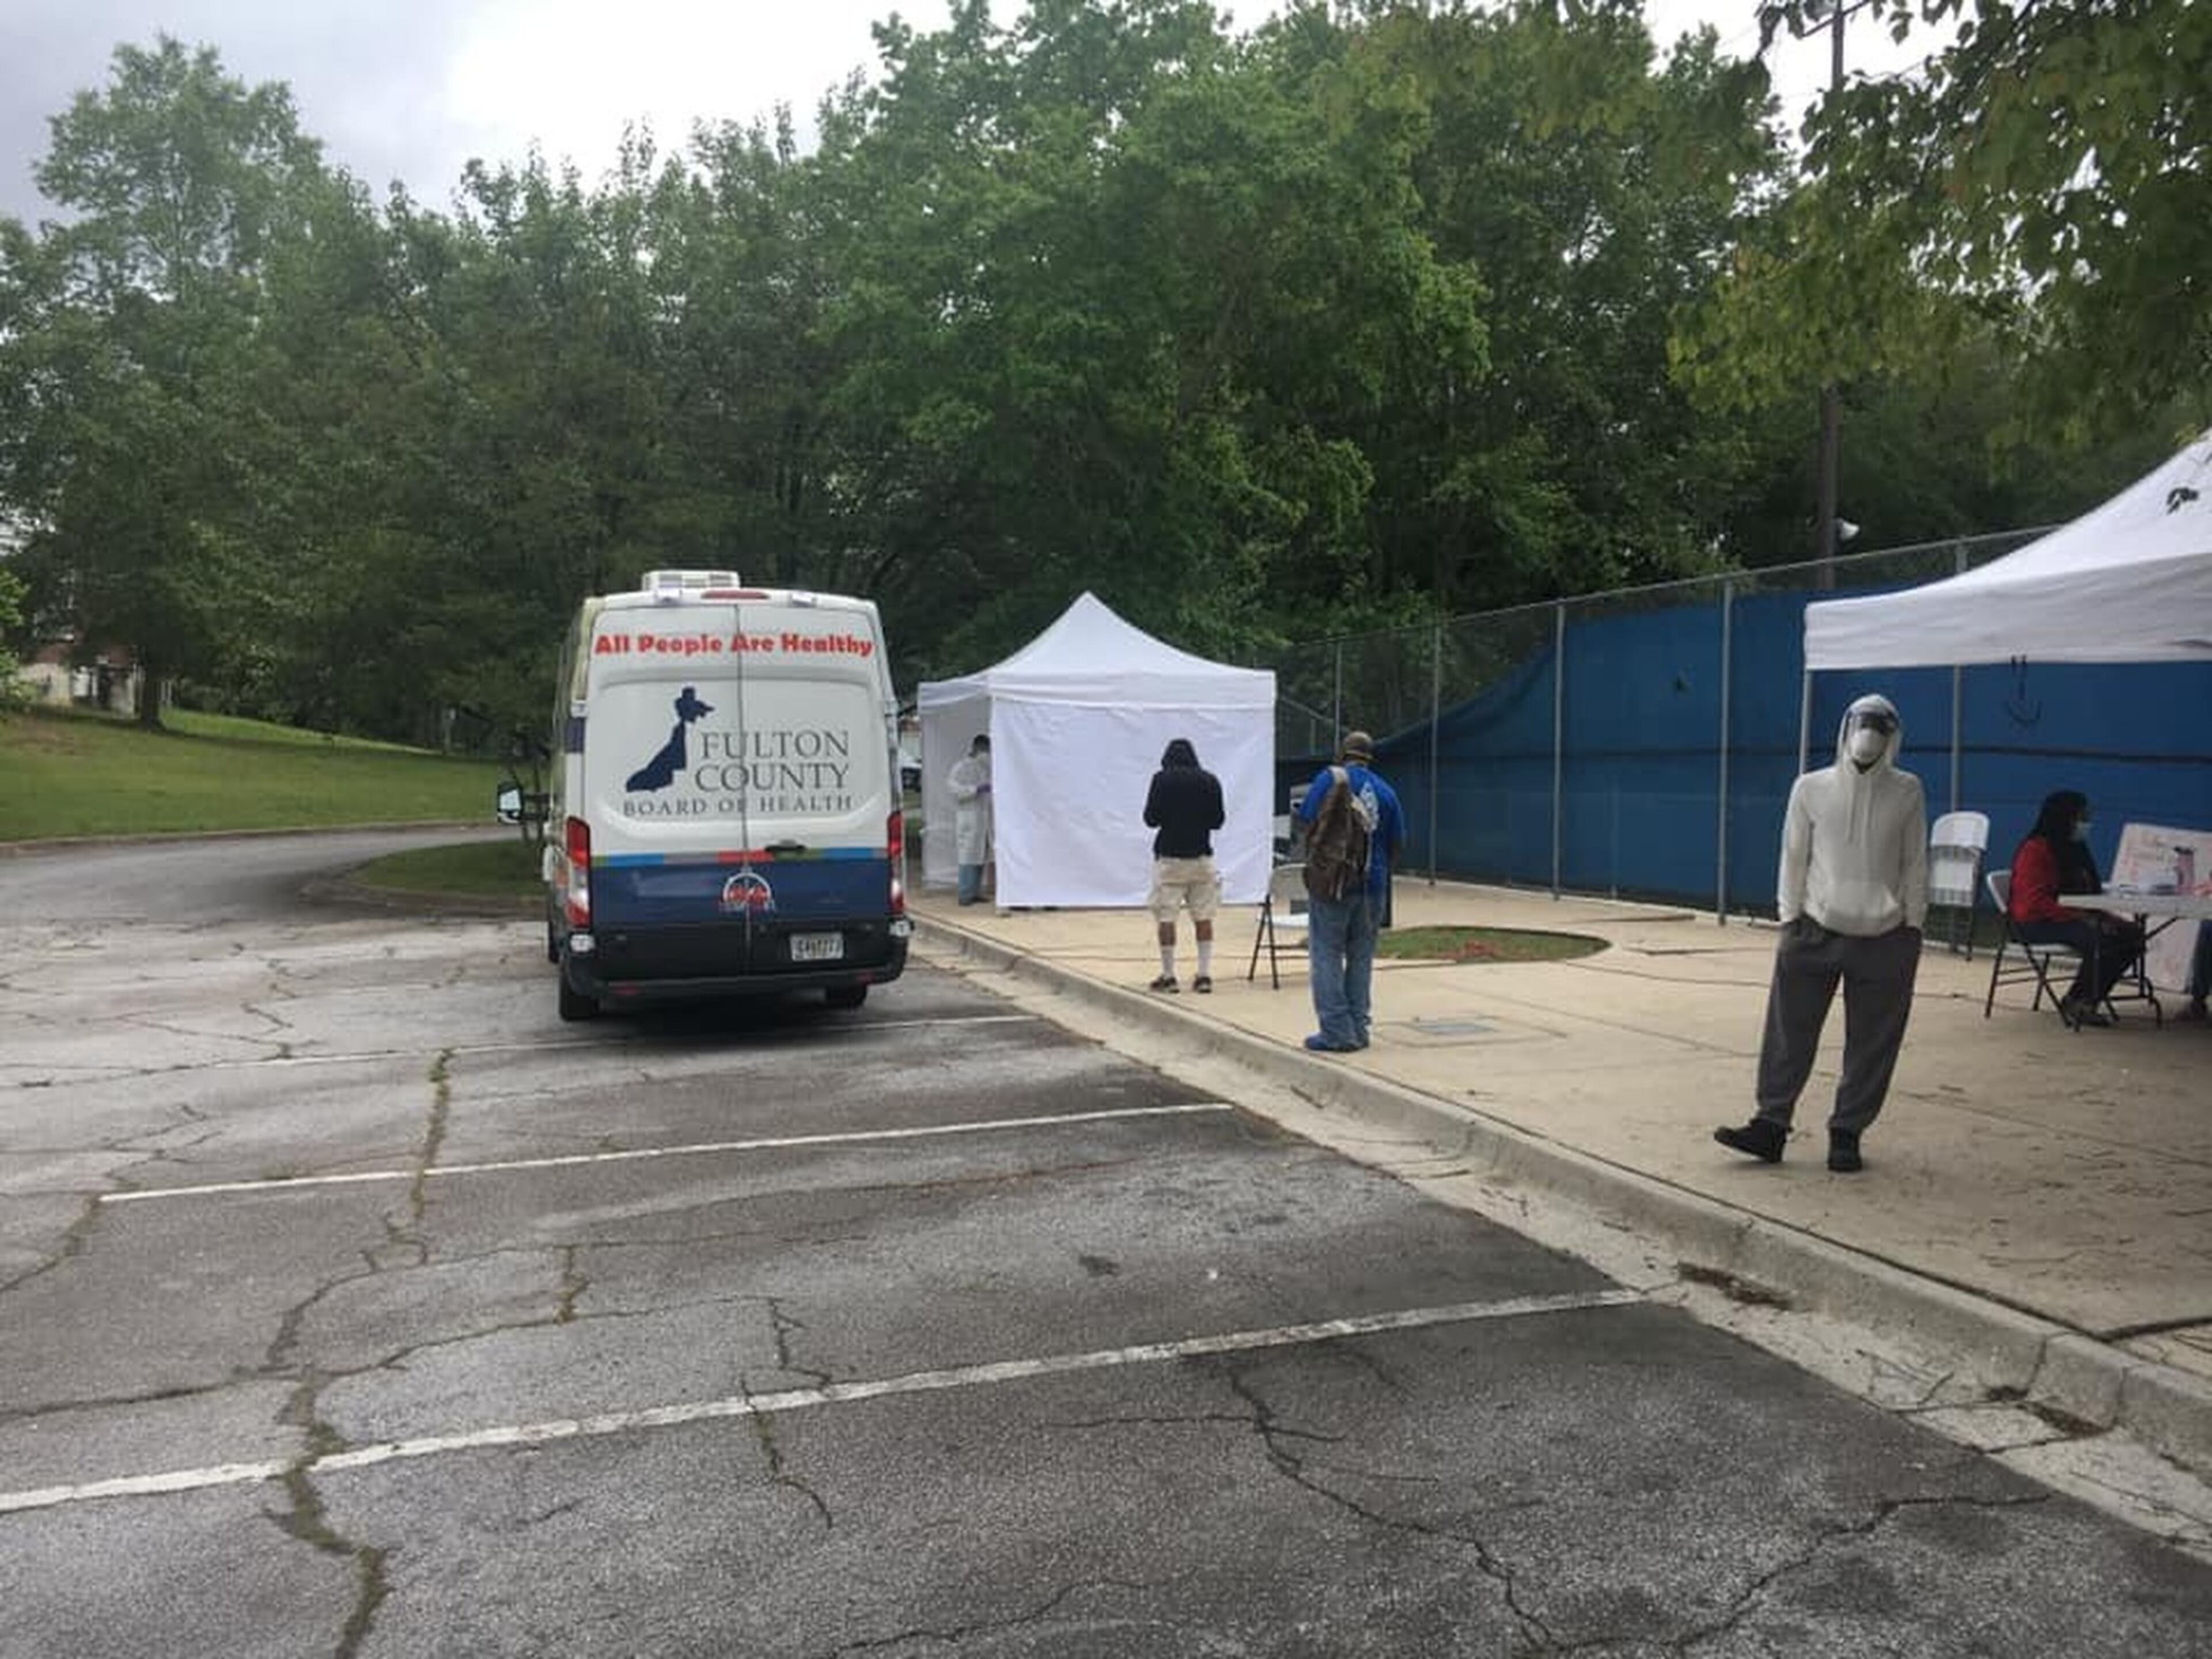
Anderson said they might send mobile testing units — like food trucks for COVID-19 tests — into a hotspot. Anderson, a former executive with BellSouth and AT&T, said he wants to hire an advertising agency that will form a marketing campaign that will use testing data to determine how and where to send prevention messages targeting communities.
He said the message might be more effective from someone the community views as a credible source, like a celebrity.
That’s exactly what DeKalb County is doing.
County CEO Michael Thurmond enlisted Atlanta rapper Killer Mike for an ad campaign he hopes will get through to young black residents. Younger people are generally less likely to suffer the most severe effects of the virus but can carry it home to vulnerable loved ones.
In DeKalb, outbreaks in long-term care facilities have helped drive coronavirus numbers. Dr. Elizabeth Ford, the county’s district health director, said Wednesday the residents and staff members of 26 different facilities account for 20% of DeKalb’s overall cases and nearly 60% of its deaths.
READ | Why DeKalb officials are worried about Hall County's COVID-19 outbreak
DeKalb has seen some of the highest case numbers in ZIP codes where the U.S. Census has counted large African American and other minority populations and a prevalence of residents with lower socioeconomic status.
But county health directors say it’s early days yet for the data and conclusions can’t be drawn. As of last Monday, race was unknown for 38% of DeKalb’s 2,532 confirmed coronavirus cases. Black residents accounted for about 62% of cases where a patient’s race was reported. The highest raw numbers of cases are in the Lithonia, Panthersville, Stone Mountain and Tucker areas.
“It’s just a really unfortunate perfect storm of being elderly, being medically fragile and possibly having some pre-existing conditions, and being of a low socioeconomic class,” Ford said. “All of those things combined certainly contribute to what we’re seeing.”
Ford’s office announced Monday that two teams guided by ZIP code data will test people in most affected areas. Their first locations are Beulah Missionary Baptist Church in Decatur and Rehoboth Baptist Church in Tucker.
“By going into ZIP Codes with the greatest COVID-19 burden, we can identify cases and protect the community,” Ford wrote in the announcement. “We will also be looking at areas that may not have a high burden because testing has not been made available.”
The board of health that covers Cobb and Douglas counties did not make its director available for an interview. When asked questions about the data, spokeswoman Valerie Crow said: “We don’t have the capacity to investigate why the numbers are breaking down the way they are.”
‘Less assumptions’
It’s hard to draw conclusions from the diagnosis data recorded in Gwinnett since March, said to Dr. Audrey Arona, health director of the Gwinnett, Newton and Rockdale County Health Department.
“Our data is very highly skewed because we were not testing a broad part of the population for a long time,” Arona said. “Now that we’ve opened up to the whole community, we’re testing more asymptomatic people. When you change the population in which you’re testing, it’s very hard to correlate percentages.”
When testing began in March, only frontline workers, people over the age of 65 and people who worked or lived in a long-term care home could get tested. In mid-April, testing was opened to anyone with symptoms. Now, anyone can get tested.
Gwinnett’s highest diagnosis rates are in two ZIP codes covering parts of Lilburn, Lawrenceville, Buford and Braselton. Both of those ZIP codes had rates of 3 or more cases diagnosed per 1,000 people. The five others with rates higher than 2.4 cases per 1,000 people are all in southeast Gwinnett County, covering parts of Lawrenceville, Lilburn, Norcross, Snellville and Grayson.
READ | Gwinnett coronavirus cases highest on county's east side
Higher rates in certain areas could be partially explained by population and household size — more multigenerational homes and densely populated places could lead to higher transmission rates, Arona said. The locations of long-term care facilities like retirement homes, where the virus poses a particular risk to seniors and people with underlying health conditions, could also raise an area’s incidence rate, Arona said.
“As we learn about this virus and more statistics are given to us, over time, we’ll be able to make assessments in real time and less assumptions,” Arona said.
Those assumptions have real-life consequences.
The city of College Park announced last Monday that it was re-opening City Hall to the public on a limited basis on Thursday after being closed for weeks. Mayor Bianca Motley Broom and City Manager Terrence Moore said they had no numerical criteria, but the number of new cases was declining enough that they felt comfortable to let some of the public back in.
But the numbers changed.
And 26 hours after the announcement, the city manager sent an email to staff saying the Thursday re-opening was being pushed back two weeks because of “improved county data concerning seven-day trends.”
Interactive ZIP code map:
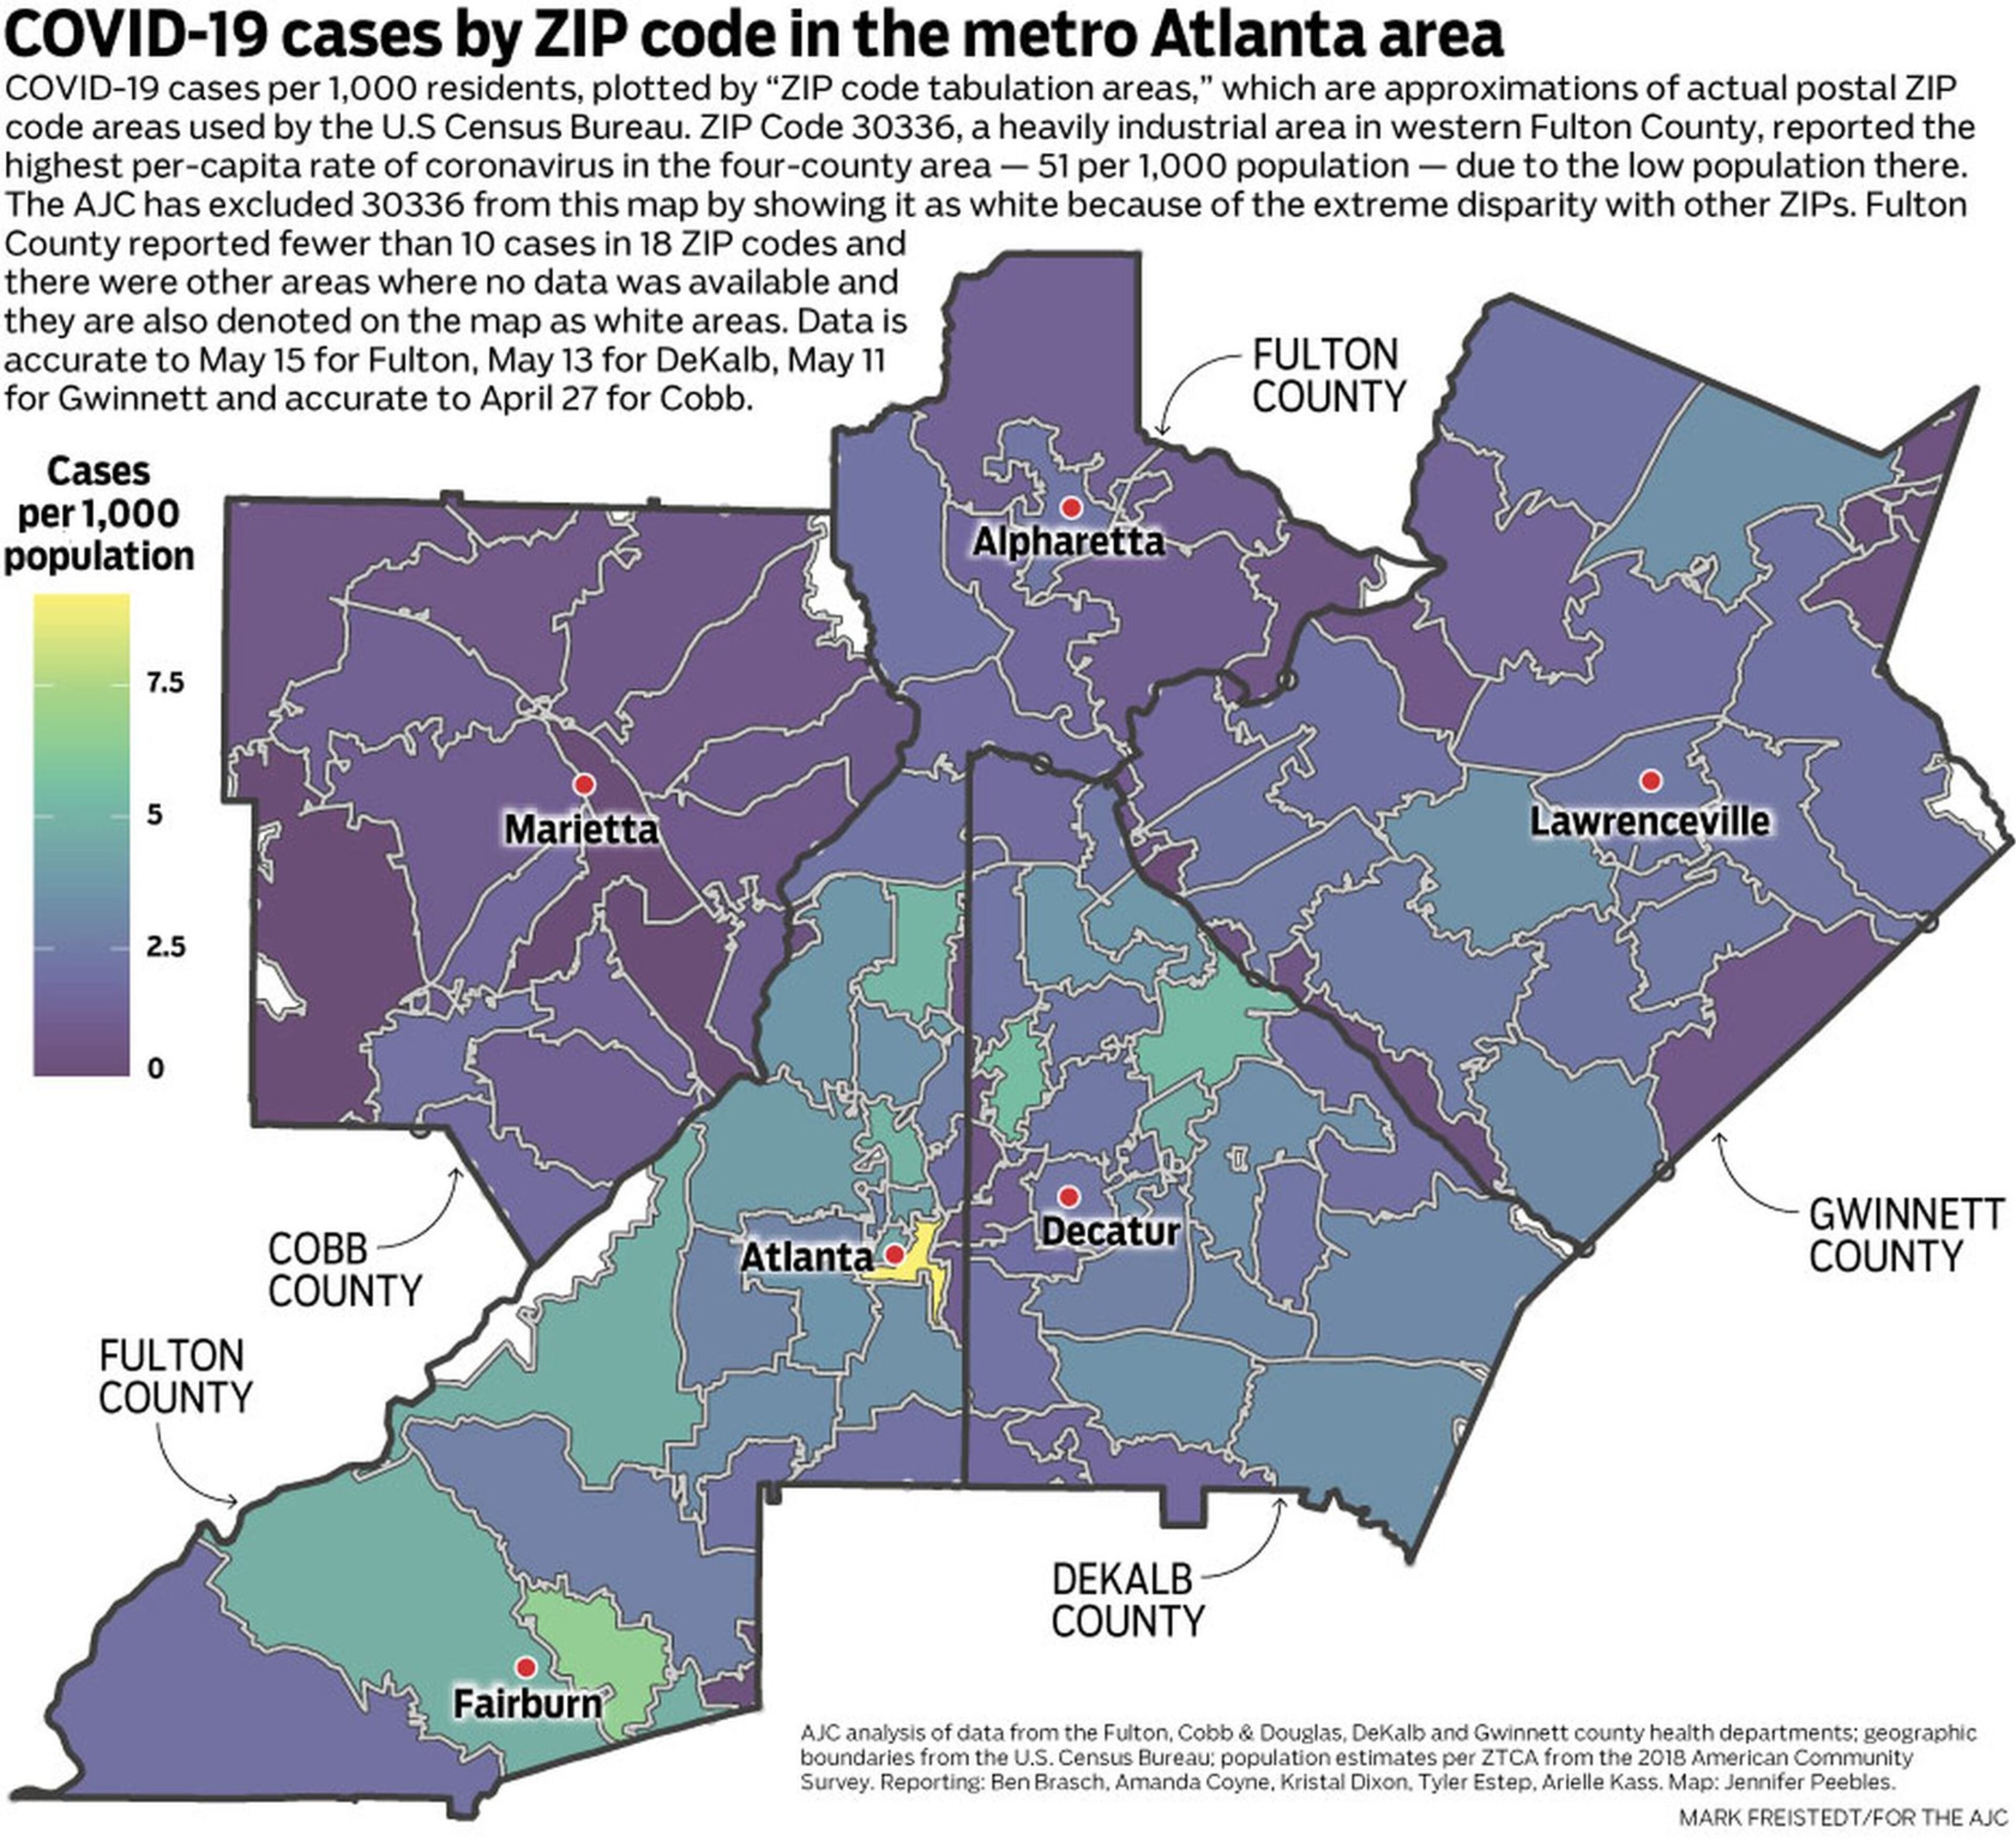
Static ZIP code map:
Hardest-hit zip codes
Recent case numbers taken from four metro counties show the ZIP codes with the highest rates of cases per 1,000 residents.
Fulton's 30312: Home to 22,275 residents with a median household income of $52,000, this ZIP area has nine cases for every 1,000 residents. The area spans some of Intown's favorite spots: from Jackson Street Bridge in the Old Fourth Ward down to the northern Grant Park/Summerhill neighborhoods.
DeKalb's 30329: With a $54,274 median household income for its 27,878 residents in the North Druid Hills area, there are about five cases per 1,000.
Gwinnett's 30044: For the roughly 88,000 residents, there are about three cases for every 1,000 residents. The median household income is $61,130.
Cobb's 30106: With about 21,742 residents with a median houehold income of $52,294 located in the county's southwest, there's a rate of about two of every 1,000 people.
Note: Of the four counties, the ZIP code with the highest per-capita rate was 30336, a heavily industrial area in western Fulton County. The ZIP had 12 cases among 234 residents, which translates to a rate of 51 per 1,000 population, which inaccurately makes the area appear to be a COVID-19 hotspot.
About the Authors

Ben Brasch is the reporter tasked with keeping Fulton County government accountable. The Florida native moved to Atlanta for a job with The AJC. If there's something important to you going on in Fulton, he wants to know about it. Help him better metro Atlanta by dropping a line, anonymously or otherwise.

Tyler Estep hosts the AJC Win Column, Atlanta's new weekly destination for all things sports. He also shepherds the Sports Daily and Braves Report newsletters to your inbox.

Jennifer Peebles is a newsroom data specialist at The Atlanta Journal-Constitution, helping reporters find and tell stories with government data (and sometimes documents, too).

Kristal Dixon covers Cobb and DeKalb county schools for The Atlanta Journal-Constitution. Before joining the AJC, Dixon worked for Patch.com and the Cherokee Tribune in Canton.