Ga. gets rosier vaccination rates than CDC with lower population estimate
As Gov. Brian Kemp celebrated Georgia administering its 5 millionth dose of COVID-19 vaccine last week, his office issued a news release that said 82% of the state’s seniors had received at least one shot.
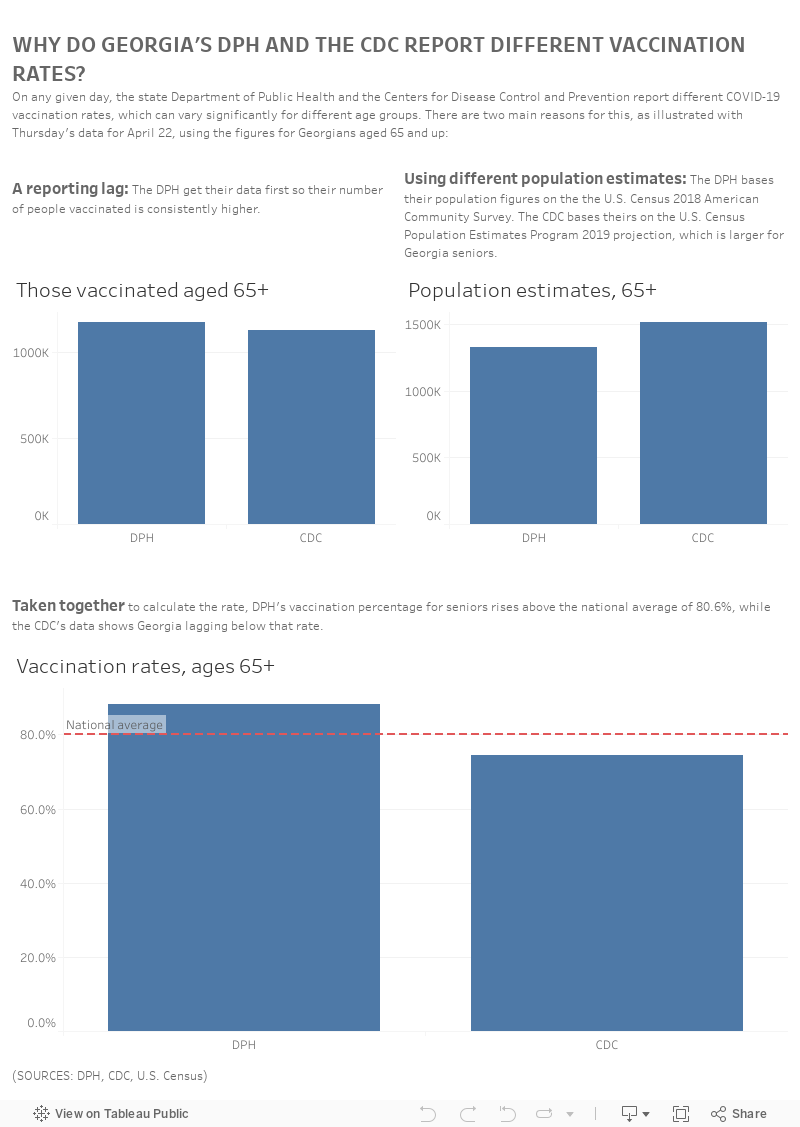
Over at the Georgia Department of Public Health (DPH), which reports to the governor, an analysis of their data looked even better — 87% of people 65 and up.
But Centers for Disease Control and Prevention (CDC) data told a less flattering story. Only about 73% of Georgia seniors had gotten one or more doses as of April 15, the CDC said. That put Georgia below the then-80% national average and in the nation’s bottom third of states. Overall, Georgia ranked fourth worst for its vaccination rate among all adults, the CDC reported.
Since DPH relaunched its vaccine dashboard earlier this month, CDC’s vaccination rates for Georgia have consistently been lower than the state’s own figures, particularly for seniors.
Georgia’s figures look better, an Atlanta Journal-Constitution analysis found, largely because Georgia officials use smaller state population estimates than the CDC. DPH and Kemp’s office even use different population estimates from one another, the AJC found.
Since the beginning of the pandemic, numerous experts have questioned Georgia’s accounting of coronavirus cases and tests, and some of the state’s handling of data has been held up for ridicule.
The way in which Kemp and other officials have chosen to represent vaccination rates is the latest example of them presenting a rosier view of the pandemic than other sources.
“I want to give them the benefit of the doubt because it does look bad,” said Amber Schmidtke, a public health researcher and former Mercer University professor who tracks Georgia’s pandemic in her widely read newsletter. “When you add to that the climate Georgia is in with a gubernatorial election next year and everything else, you don’t want to assume any of this is political, but it starts to feel that way.”
Kemp’s office denied any effort to manipulate data to make Georgia’s vaccination effort appear better than it was.
Still, independent public health experts questioned Georgia’s reliance on smaller population estimates to track vaccinations, especially when the state uses larger population estimates on its separate COVID-19 daily status report, a dashboard that tracks infections and deaths.
“I would take the estimate that’s more current,” said Dr. Thomas Trikalinos, a professor of health services, policy and practice at Brown University in Rhode Island, a state that uses the same population projections as the CDC.
Different estimates
The U.S. Census Bureau publishes different population estimates for different purposes. The most current comes from the 2019 Census Population Estimates Program, or PEP, which provides population estimates each year based on birth, death and migration data. This is the estimate the CDC uses.
Kemp’s office told the AJC it began tracking vaccination percentages for seniors internally using the Census Bureau’s 2019 American Community Survey, a five-year population average, in January, because the Census website describes it as the “most reliable.”
The ACS collects survey responses over five years to build a sample size that provides useful estimates by detailed demographic categories and small geographic areas such as census tracts. The 2019 ASC population estimate for Georgia is lower than the 2019 PEP.
At the time Kemp’s office began using ACS data, the CDC hadn’t yet begun tracking vaccination rates nationally using the 2019 PEP estimate. Once the CDC did, its rates for Georgia and states gaining population dipped.
CDC added senior data to its tracker in March.
“We obviously didn’t know which (estimate the CDC) would use once they finally started publicizing that (senior) data,” spokesman Cody Hall said. “We continued to use the same valid, Census Bureau data following the updated CDC website to prevent confusion about why the percentage we had publicized for weeks suddenly decreased.”
Kemp’s office stuck with ACS data instead of switching to the CDC’s methodology to avoid suspicions of “data manipulation,” Hall said. “As you can imagine, doing so would have led to the same questions around suspected data manipulation that you are now submitting.”
DPH’s vaccine dashboard
While the governor’s office was tracking vaccination rates internally using the 2019 ASC survey, DPH was publicizing vaccination rates to the public on its online vaccination dashboard based on the Census Bureau’s 2018 ASC survey, an older dataset which had an even smaller population estimate for Georgia.
The department’s vaccination rates consistently appeared higher than what the CDC showed for Georgia because the population base used was smaller. A lag in reporting doses to CDC also played a small role.
Nancy Nydam, a DPH spokeswoman, said DPH prefers the 2018 ACS data because of a built in “geodatabase” that more easily plugs into its dashboard to instantly produce county-level datasets so that DPH doesn’t have to build its own.
DPH also has access to more patient data than CDC does, which helps make DPH’s analysis more accurate, she said.
The newer 2019 ACS data would provide DPH with more recent estimates and the same advantages as the earlier version, though it might require more technical work to integrate with DPH’s maps.
Still, there are also indications that DPH’s population estimates are too small.
In Clarke and Oconee counties, for example, DPH reports 100% of people 75 to 84 have received at least one dose.
Schmidtke, the former Mercer professor, said given rates of vaccine hesitancy and access issues, particularly for minorities and homebound seniors, that seems unlikely.
Kemp: ‘Pandemic politics’
In numerous public events to promote Georgia’s vaccination campaign, Kemp has made it clear whose vaccination rates he prefers.
In March, Kemp pushed back on reports of Georgia’s lagging vaccination rates and criticized the media for highlighting the CDC’s data, arguing Georgia was outperforming the country with seniors. And at the time Georgia was.
“The media and those playing pandemic politics will continue to focus on whichever statistic of the day paints Georgia in a bad light,” he said March 16. “But I will tell you I’m not worried about politics. I’m worried about following the science and the data about who is most vulnerable.”
Kemp’s press releases in March used 2019 ACS estimates for both Georgia and national data, an apples-to-apples comparison. But the U.S. average has since surpassed Georgia’s — whether compared by ACS or PEP figures.
This month, Kemp’s vaccine press releases have dropped the comparison to the national figures.
A history of data troubles
This isn’t the first time that Georgia has presented data that showed the pandemic or the state’s response in a more favorable light.
Georgia briefly combined diagnostic and antibody tests early in the pandemic, making it appear the state was testing more people for active infections than it was.
On another occasion, a chart suggested infections in the biggest counties were dropping over time because the dates were out of order.
Another chart showing infections by date of symptoms made it appear early in the pandemic that cases in Georgia were plummeting rather than clearly explaining that the most recent days featured incomplete data.
Georgia also was slow to publish suspected COVID-19 infections determined by antigen tests. DPH’s daily status report added antigen cases in November, but still does not include suspected infections on its map showing the rate of spread by county.
Data specialist John Perry contributed to this report.