Getting it Right: Solving GHSA challenges with math, Part V
Welcome back. This is the fifth part in a series on answering the question "Which teams are deserving of a playoff invitation?" In it I'll outline a model I'll refer to as "Extended Standings" and over the course of the series I'll provide the exact details so anyone interested can independently verify the results.
Let's return to our discussion on pairwise comparison from Part III by looking at the concepts of probability and likelihood.
In daily usage, probability and likelihood are often used interchangeably, but in statistics they are distinct (although related) terms that will help us determine which teams are deserving of a playoff invitation.
Revisiting our 1960 American League example, specifically the pairing between the New York Yankees and the Boston Red Sox, understand that each team is represented by a rating, all the ratings together are referred to as a set of ratings, and there is some relationship between two ratings which gives us the probability of one team defeating the other.
We'll start by using our stepwise comparisons from Part III to determine if the rating for the Yankees was either Evenly matched (meaning a 0.500 probability) with the rating for the Red Sox, or Slightly better (0.550 probability), Better (0.700 probability), or Much better (0.850 probability) than the rating for the Red Sox.
As a reminder the Yankees went 15-7, or 0.682, against the Red Sox that season.
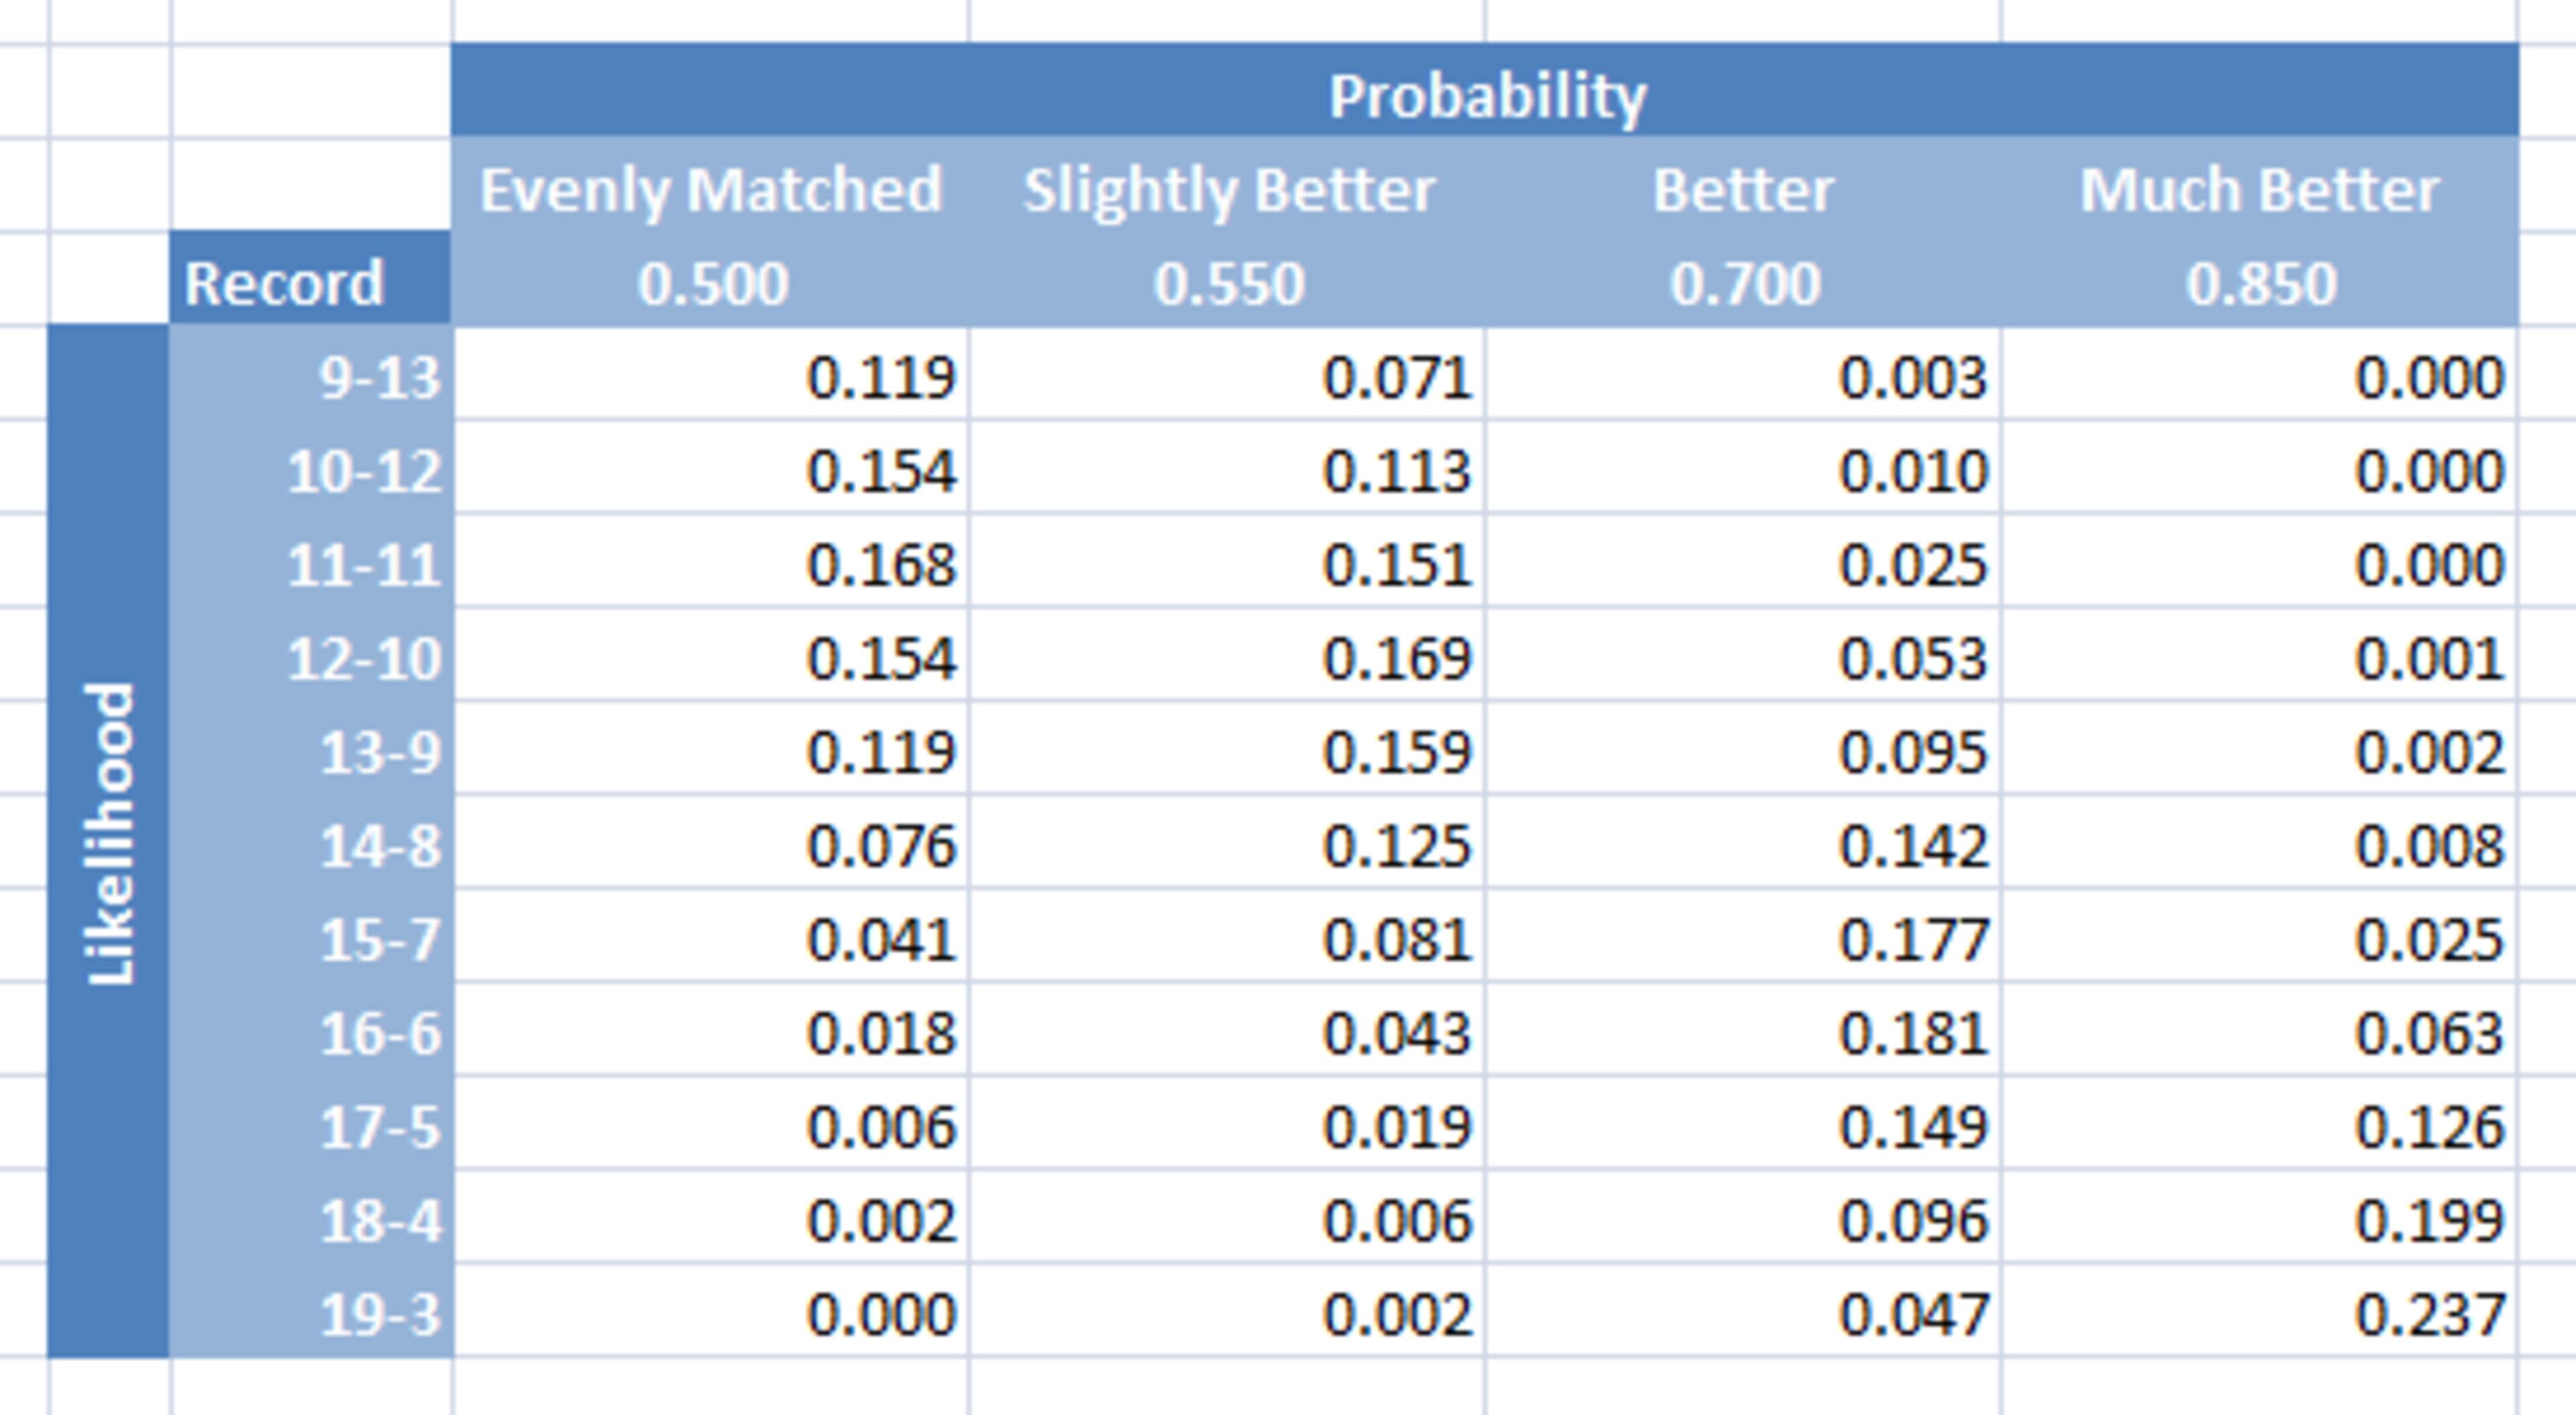
For now it's better to concentrate on the concepts over the math, so let's refer to the following chart during the discussion. I'll call it the probability-likelihood matrix and it shows the different possibilities of the Yankees getting anywhere from 9 to 19 wins out of 22 games against the Red Sox:

Reading the matrix down from the Evenly matched column we can see the probability for any given record if the rating for the Yankees was Evenly matched with the rating for the Red Sox. For example, moving down the column to the 15-7 row shows the probability of the Yankees going 15-7 over the Red Sox would have been 0.041. We can also note that the highest probability in the Evenly matched column is 0.168, which is the row for the Yankees going 11-11 against the Red Sox, or 0.500. This mirrors the 0.500 probability for the Evenly matched column.
Now reading the matrix down from the Slightly better column to the 15-7 row shows the probability of the Yankees going 15-7 over the Red Sox would have been 0.081 if the rating of the Yankees was Slightly better than the rating for the Red Sox. We can also do the same for the Better and Much better columns to find 0.177 and 0.025 probabilities of going 15-7 respectively.
Note that reading the probability-likelihood matrix down the columns finds the probabilities, but reading the matrix across the rows changes the term to likelihoods even though we're looking at the same numbers. Comparing likelihoods allows us to determine which column is the most likely.
For example, starting with the row for the 15-7 record, which is more likely, that the rating for the Yankees was Evenly matched or Slightly better than the rating for the Red Sox? Since Slightly better has a higher likelihood than Evenly matched (0.081 to 0.041), we would say it's more likely the rating for the Yankees was Slightly better than the rating for the Red Sox as opposed to Evenly matched.
Now comparing the likelihoods across the entire row for the 15-7 record shows that the highest likelihood, 0.177, belongs to the Better column. In other words, based on the 15-7 record, the rating for the Yankees was most likely Better than the rating for the Red Sox as opposed to Evenly matched, Slightly better, or Much better.
Looking elsewhere in the matrix we can also see that a 12-10 or 13-9 record would indicate the rating for the Yankees was Slightly better than the rating for the Red Sox and any record at 18-4 or better would indicate the rating for the Yankees was Much better.
But we can reach even more precision by doing away with the stepwise labels and adopting a continuous range of probabilities from 0.000 to 1.000 across the top of the matrix.
Here’s a small but relevant segment of those probabilities across the top of the matrix:

Comparing the likelihoods across the row for the 15-7 record shows that the highest likelihood, 0.180132, belongs to the 0.682 probability column. In other words, based on the 15-7 record, the rating for the Yankees most likely had a 0.682 probability of defeating the rating for the Red Sox.
This makes perfect sense because 15 wins / 22 games = 0.682.
Instinctively it seems reasonable that a good estimate for the ratings is the set of ratings that maximizes the likelihood of all the results. Perhaps unsurprisingly, this approach is referred to as the maximum likelihood method, which has been around at least since the 1700s although it was popularized in the 1920s by renowned statistician R.A. Fisher.
In this simple example of Yankees versus Red Sox, the maximum likelihood works it's way to finding the 0.682 probability, which is a lot of work to find a number that we already knew from the winning percentage.
But let's expand our 1960 American League example to note that the Baltimore Orioles went 16-6 against the Red Sox.
If we used our stepwise approach, we'd conclude that the Yankees and the Orioles were both Better than the Red Sox. Obviously the Yankees and the Orioles would be equal since the stepwise approach provides no other distinctions.
If we used our continuous approach, we'd conclude the Yankees would defeat the Red Sox with a 0.682 probability while the Orioles would defeat the Red Sox with a 0.727 probability. Obviously the Orioles would be favored over the Yankees to some relatively small degree.
But the Yankees went 13-9 against the Orioles, so what happened?
Because variability is simply part of life, these types of discrepancies occur all the time and sports is no exception.
However, the difficulty with these contradictory results is that since the probability of each comparison is determined by a single rating for each team, no set of ratings will fully explain the results. In short, either the rating of the Yankees was higher than the rating of the Orioles or the other way around, but not both.
So how do we resolve this? By finding the set of ratings that maximizes the likelihood for the entire set of results.
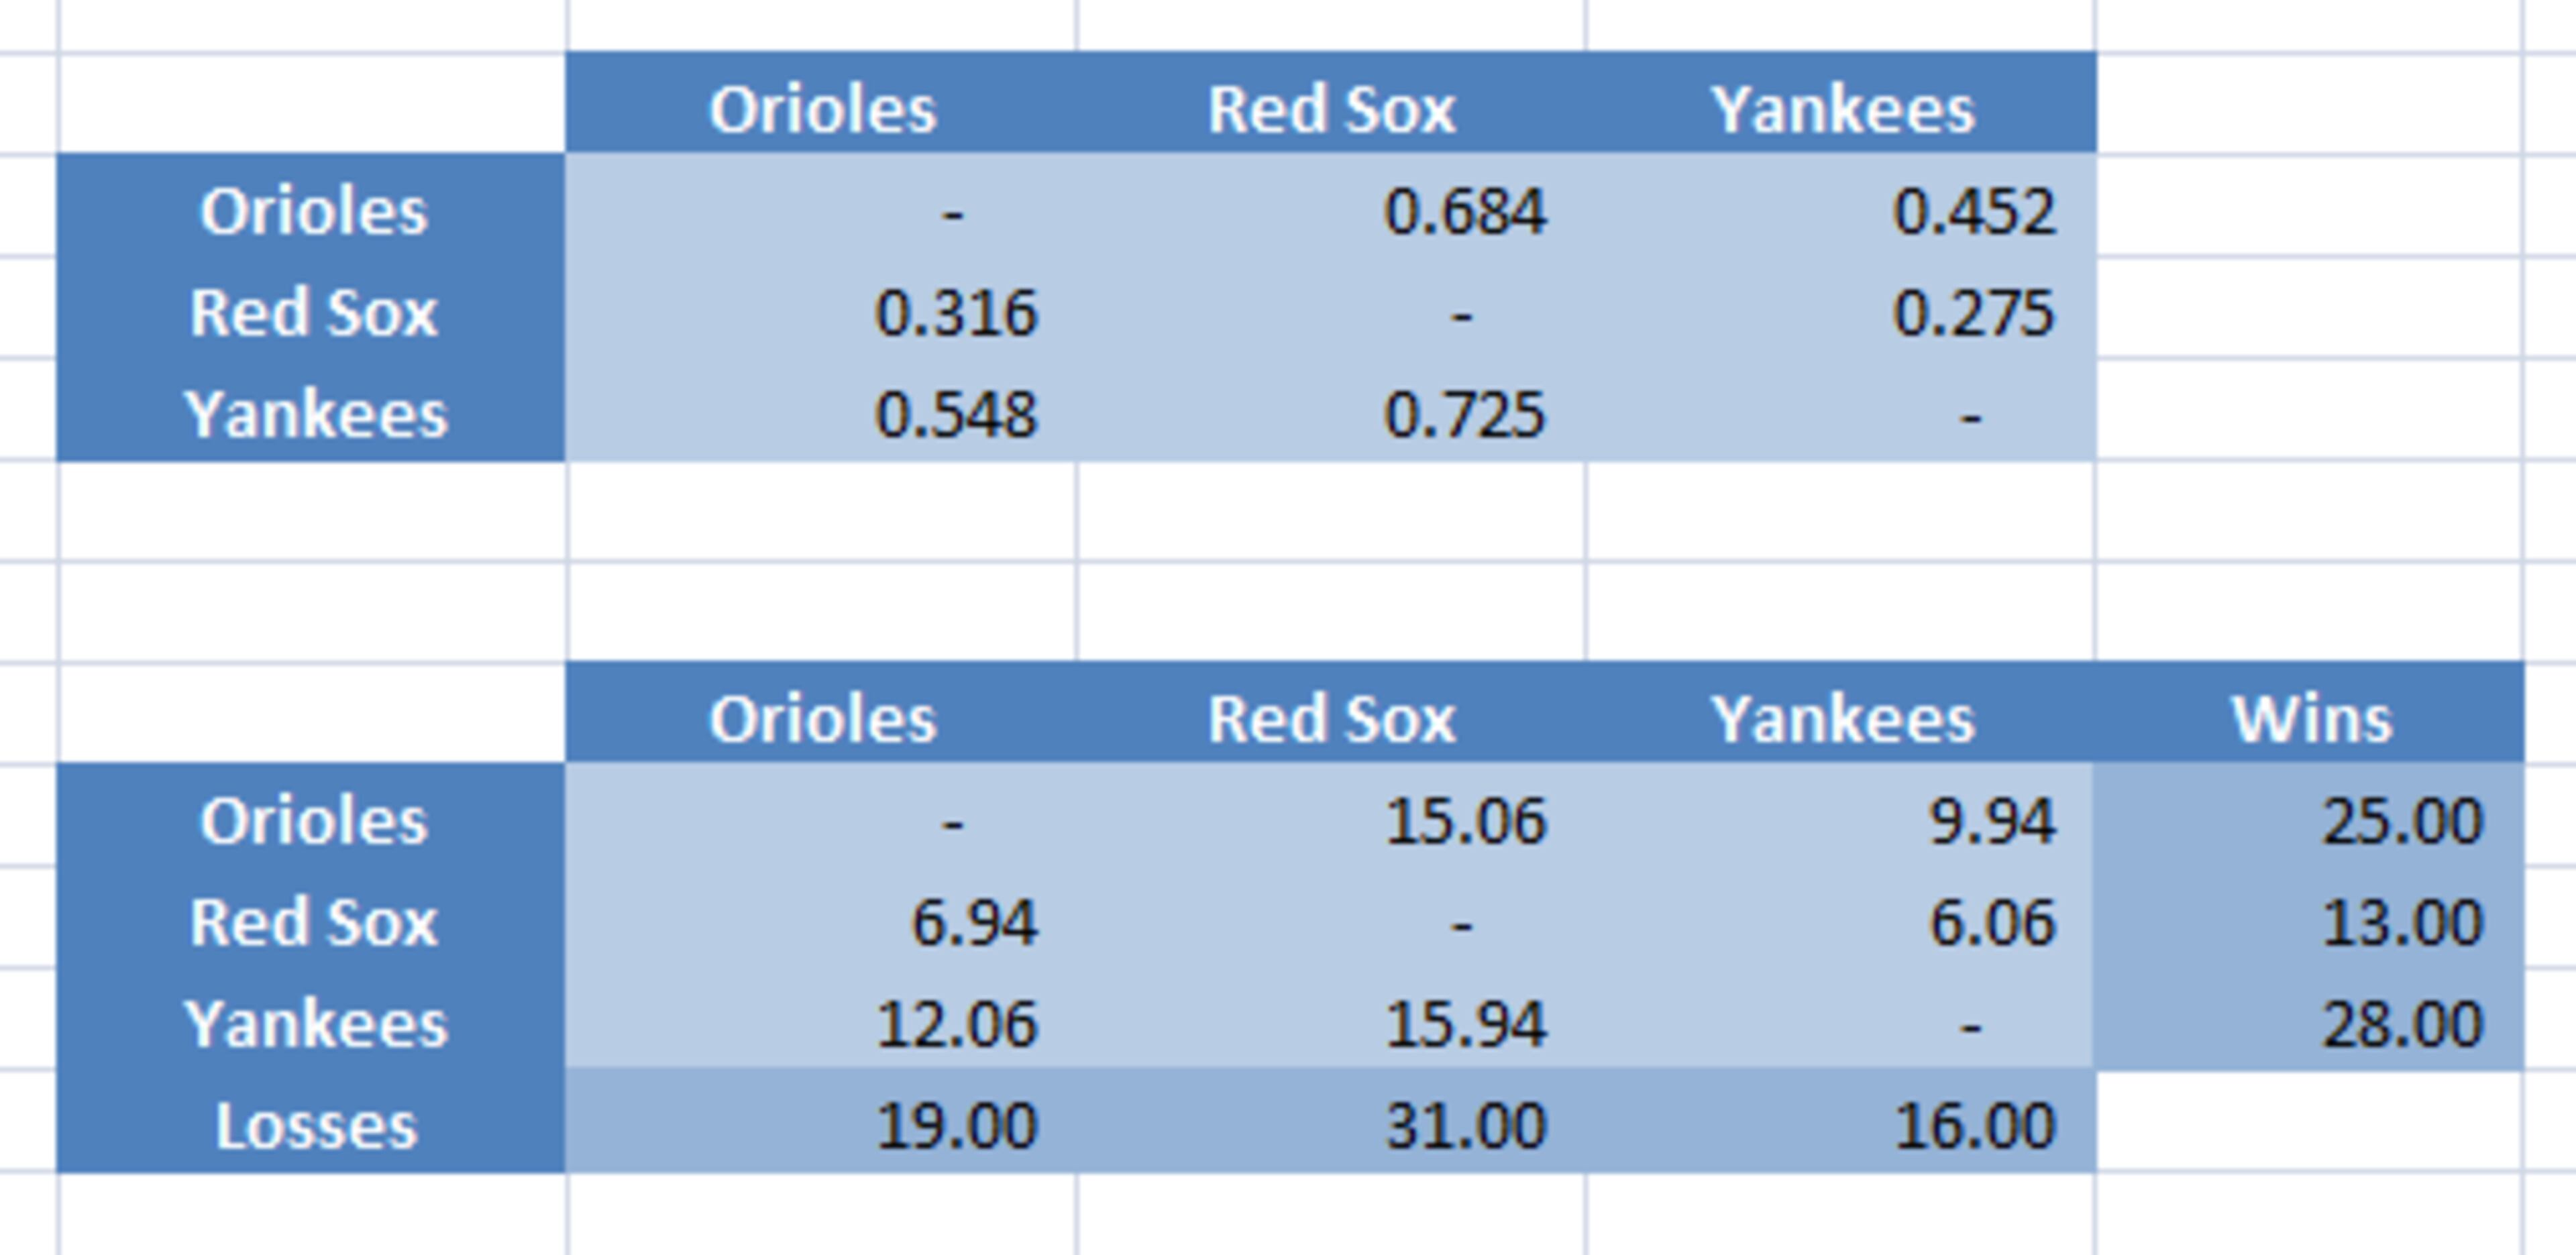
I'm saving the details for my next post, but I can show that the set of ratings that maximizes the likelihood for all the results of between the 1960 New York Yankees, Boston Red Sox, and Baltimore Orioles is the set of ratings that produces the following probability chart and the associated "corrected record" chart below it:

In it we can see the Yankees actually had a 0.725 probability of defeating the Red Sox. This translates into a 15.94-6.06 record as shown in the corrected record chart at the bottom. Note also that the total wins and losses for each team remains exactly the same, but the way they are apportioned is adjusted to account for the discrepancies in the individual parings.
At any rate, the use of maximum likelihood gives the Extended Standings rigor, one of our five characteristics outlined in Part I.
OK, I’ll close for now, but I know many of you are itching for more details.
Don't worry, now that I've laid most of the conceptual background, the next part in the series will crack the Extended Standings model wide open, so stay tuned!
More Stories
The Latest


