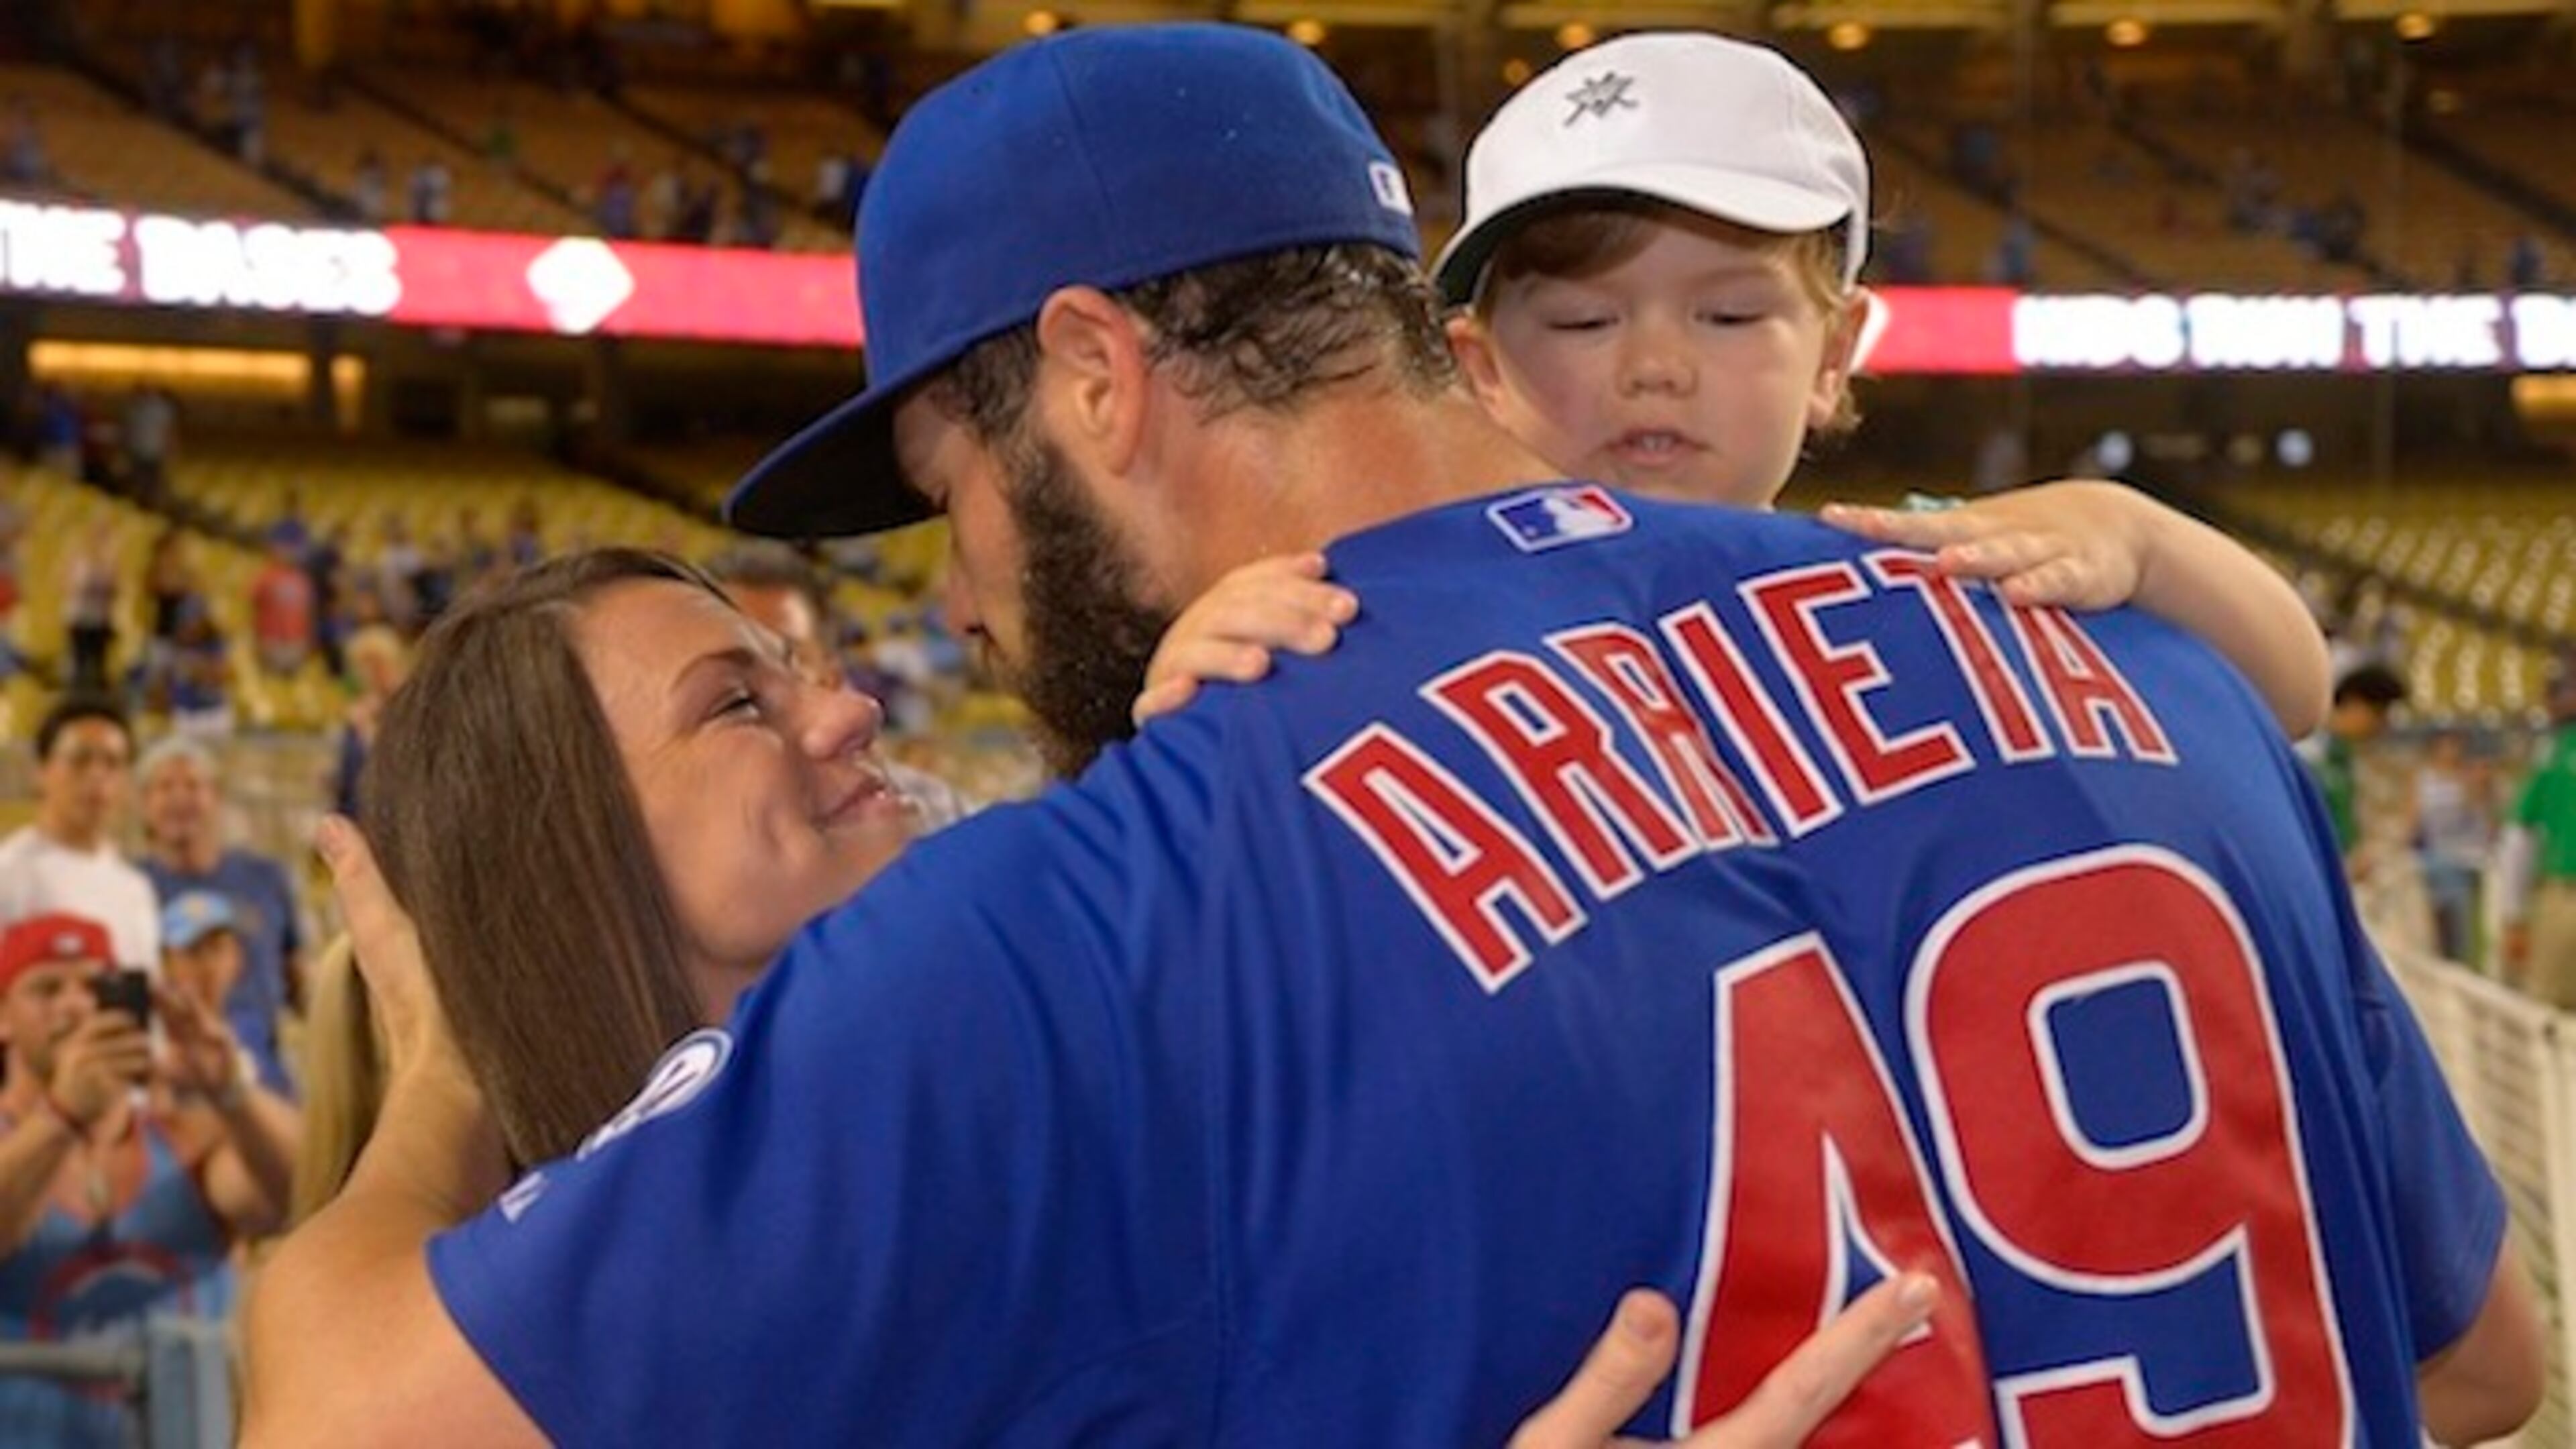
Spurt of no-hitters may not be all that exceptional

When Jake Arrieta of the Chicago Cubs threw a no-hitter on Aug. 30, it was the sixth in 81 days and the 250th no-hitter of the modern era. The major league record for no-hitters in a single season is seven.
Given that an average season has roughly two no-hitters, the fact that three seasons’ worth came in such a short span could make even close watchers of the game wonder if something unusual was going on.
Have no-hitters become more common? Is offense continuing its recent descent from the heights of the steroid era? Or is it just a blip?
The easiest question is whether offense is continuing the sharp decline that has been noted over the past several seasons. As any fan of the Toronto Blue Jays can attest, the answer is no. Compared with the last two seasons, nearly every offensive category has risen throughout the league in 2015.
In an average game this season, a team can expect 4.23 runs, 8.69 hits and 1.00 home run, the highest for each category since 2012. Strikeouts are occurring at the second-highest rate in history, and walks are at their lowest rate since 1968. But there is nothing so exceptional about this season that would make no-hitters more likely than in the last four or five years.
As to whether no-hitters have become more common, that is a bit more complicated.
Since 1993, there have been 61 no-hitters, an average of 2.65 a season, an increase over the historical average of about two. But the number of games played has also increased because baseball added two teams in 1993 and in 1998, providing more opportunities to throw no-hitters.
This season will have 324 more games than there were in 1992 (the year before the Rockies and the Marlins joined the National League), which means there will be 648 more opportunities for a team to throw a no-hitter.
Even when accounting for the increase that would be expected to happen as a result of the expansion years, as well as the ebb and flow of events as random as no-hitters, six no-hitters this season is not as impressive as the 1990 and 1991 seasons, which share the record of seven no-hitters with 2012.
Observers often cite 1990 as having the record with nine no-hitters, but one occurred in a rain-shortened game and the other in a road loss, so by MLB’s modern definition of a no-hitter, in which nine innings must be pitched, neither qualifies.
Based on the number of games, 1991 reigns with a no-hitter occurring once every 601.1 games, narrowly edging 1990, which had one for every 601.4. In 2012, no-hitters came once every 694.3 games, and through Friday the rate this season was one in every 670.3.
But no-hitters are unpredictable. In the two years surrounding the explosion of no-hitters in 1990 and 1991, there was just one no-hitter thrown in 8,424 opportunities, so any attempt to find a pattern is most likely a fool’s errand.
With a month remaining in the season, there should be 419 games from Saturday, which will offer 838 opportunities for the record to be tied or broken. There could be two more hitters thrown, or there could be no more no-hitters for two years, and neither possibility would be statistically abnormal.
That is simply the nature of the beast.

