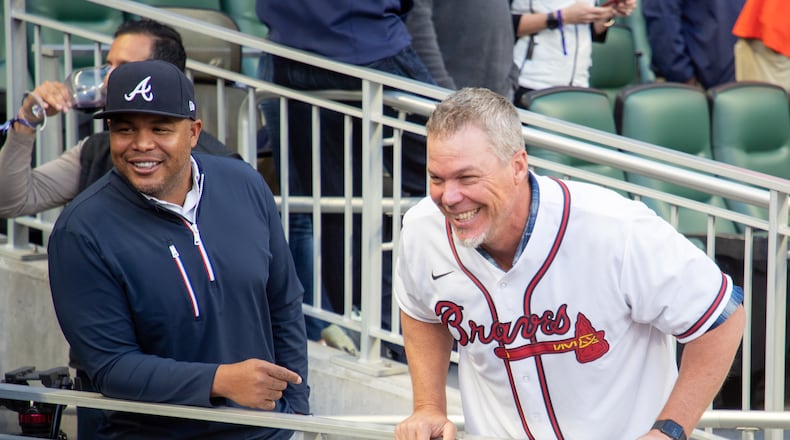
Scott Rolen made All-Star teams. He won Gold Gloves. Of his 17-year career, most was spent in the National League, which meant I saw him a lot. Did I consider him a good player? Yes. As good as, say, Chipper Jones? No.
Rolen became Hall-of-Fame-eligible the same year as Chipper and Jim Thome, both of whom gained immediate enshrinement. Rolen drew the 17th-most votes – 10.2% of the needed 75%. Andruw Jones, also in his first year, got 7.3%. On that day in January 2018, the best that could be said of S. Rolen and A. Jones was that they’d earned one more look.
On Tuesday, Rolen was elected to the Hall with 76.3% of the vote. The numbers he posted on the field haven’t changed since 2018. What changed is how voters came to view those numbers.
Rolen’s back-of-the-baseball card stats: 316 home runs, 1,287 RBIs, a career batting average of .281. He hit 30 homers in a season three times. He batted .300 twice. He finished among the top 10 in MVP voting once. Only three times over 17 seasons would he lead his team in WAR, as calculated by Baseball-Reference. That said, WAR is the reason he’s a Hall of Famer.
The old arguments still adhere. WAR isn’t easy to understand. FanGraph’s WAR doesn’t always mirror B-Ref’s, to say nothing of Baseball Prospectus’ WARP. WAR tries to account for defense, but there’s no consensus on which defensive metrics mean the most.
The reality: WAR has become the first number I check – above homers and wins/losses, above RBIs and ERA – and I’m not alone. Indeed, every club has an analytics department. Every club has its own formula for WAR.
Rolen’s career WAR was 70.1. Derek Jeter’s was 71.3, Barry Larkin’s 70.5. Tony Gwynn’s was 69.2, John Smoltz’s 69.0. Three of those four made the Hall on the first ballot; Larkin made it on the third. The nice thing about WAR is that it tells us what kind of company a player has kept.
Rolen had 12 seasons of 3.4 WAR or better; he had eight of 4.5-plus. Above 4.0 is All-Star caliber. Above 6.0 is superstar stuff. Rolen had two 6.0-plus seasons and another of 5.9.
No, he wasn’t Chipper – career WAR: 85.3 – but he was never less than a very good player who did everything well. Rolen’s career OPS+ was 122, 100 being league-average. His career defensive WAR was 21.2, better than Mike Schmidt (18.4) and way ahead of Chipper (minus-0.9) and George Brett (2.2).
In a pre-analytics world, Rolen doesn’t make the Hall. I didn’t vote for him in his first year. (My ballot then: Bonds, Clemens, Andruw, Chipper, Edgar M., Mussina, Manny, Schilling, Thome and Larry W.) I did every year thereafter.
We scribes can’t just go by what we saw. Nobody sees everything. If you’d asked, while both were playing, “Who was better – Rolen or Fred McGriff?”, I’d have said the latter, mostly because I saw him more. WAR said otherwise. The Crime Dog’s was 52.6.
That Rolen made it on the sixth ballot – 10 is the limit – gives up hope Andruw (career WAR: 62.7) will make it next year or the next. A. Jones received the fourth-most votes this time. He has gone from 7.3% in 2018 to 7.5 to 19.4 to 33.9 to 41.4 to 58.1 this time. Andruw is another who has benefitted from further consideration.
In 2018, there was no guarantee he’d get the minimum – five percent – to keep him on the ballot. Now it’s clear he’ll hit 75% soon, this despite a lobbying effort from Bill James, who invented sabermetrics, to keep him out. ESPN’s David Schoenfield describes the case for A. Jones thusly: “He’s the best defensive center fielder of all time – and he hit 434 home runs.”
Your response might be: Isn’t that enough?
The above is part of a regular exercise, written and curated by yours truly, available to all who register on AJC.com for our free Sports Daily newsletter. The full Buzz, which includes more opinions and extras like a weekly poll and pithy quotes, arrives via email around 1:30 p.m. on Monday, Wednesday and Friday.
FAQ: How do you sign up? Go to the AJC.com home page. Click on “newsletters” at the top right. Click on “Sports Daily.” You’ll need to enter your email address. Thanks in advance, folks.
About the Author
The Latest
Featured


