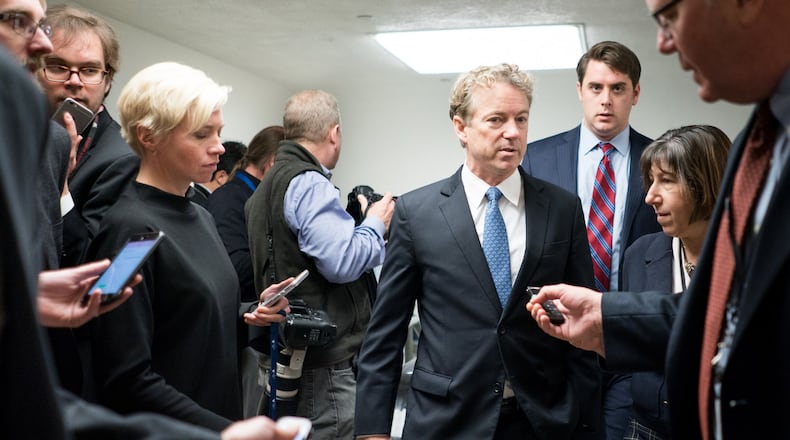
“George W. Bush doubled the debt from $5 trillion to $10 trillion. President Obama doubled the debt from $10 trillion to $20 trillion. Now we’re on course to exceed $30 trillion in the next seven years or so.”
— Sen. Rand Paul, R-Ky., on Thursday, Feb. 8, 2018 in a Senate floor speech
As the House and Senate were rushing to head off a government shutdown during a late-night session on Feb. 8, Sen. Rand Paul,. R-Ky., was doing everything he could to slow the rush to passing a new spending bill.
In a lengthy floor speech, Paul took aim at lawmakers who wring their hands about the rising debt but then vote for legislation that adds red ink.
We found that this assertion about debt piling up under previous presidents and Trump was largely accurate, but needs a few bits of context.
Using the Treasury Department's "Debt to the Penny" calculator, we were able to pinpoint the amount of debt created under each president.
When Bush was sworn in on Jan. 20, 2001, the gross federal debt was $5.73 trillion. By the time he left office on Jan. 20, 2009, it was $10.63 trillion. So Paul is on target with the numbers on Bush’s watch. As for Obama, the debt rose on his watch to $19.95 trillion. That’s not quite $20 trillion, but it’s awfully close.
While Paul is basically right on the numbers, there is some nuance to add:
• Paul was using the larger of two measures for debt: gross federal debt, which includes debt not just held by the public but also what one part of the federal government owes to another part of the federal government. The debt figures would have been smaller if he’d only used publicly held debt, another commonly used measurement.
• It’s an exaggeration to personalize the debt increase — saying Bush and Obama both “doubled” the debt. Other factors beyond presidential actions helped enable that doubling, including demographic factors such as the aging of the Baby Boom; events beyond the president’s control including the Great Recession; and Congress’ actions in setting spending levels. Both presidents spent at least part of their terms with the opposing party controlling all or part of Congress.
Paul also said, “Now we’re on course to exceed $30 trillion in the next seven years or so.” Officially, the Congressional Budget Office, Congress’ nonpartisan number-crunching agency, has not published this specific projection yet, but from what we can piece together, Paul has a point here, too.
Even before the Republican-backed tax bill and the recent spending bill were enacted, the debt was set to soar.
In its official projection from June 2017, the CBO estimated that the debt would rise steadily from $21.2 trillion in 2018 up to $30.7 trillion in 2027.
If you consider “the next seven years or so” to be 2025, then the tax and spending bills passed in the past two months would have had to add an additional $1.8 trillion to the projected deficit to hit Paul’s $30 trillion debt figure by that year. Did they? The best estimates we can find say yes.
For starters, the CBO released a letter after the tax bill was passed in December 2017 that said the debt held by the public would grow by a cumulative $1.65 trillion through 2025 as a result of the bill. (In this case, the CBO used publicly held debt, the smaller of the two debt measures.)
So the tax bill alone would bring the debt level to at least $29.85 trillion by 2025.
Paul’s office did not respond to an inquiry for this article.
Our ruling
Paul is essentially right on all of the numbers. That said, his comment was wrong to personalize the cause of the debt increases. While Bush and Obama played a role, so did other factors including demographics, external events, and congressional actions driven by the other party.
We rate the statement Mostly True.
About the Author
The Latest
Featured


