Rich Atlanta communities pull far ahead of the rest, report says
Since 2000, the metro Atlanta economy has suffered two recessions – one of them painfully deep — but many of the region’s less affluent communities never bounced back.
And since more prosperous areas have rebounded strongly, the gap has grown between areas of opportunity and the areas where it is lacking, according to an analysis of government data by the Economic Innovation Group.
For those at the bottom, there's never been a recovery, said John Lettieri, EIG president.
"They are living in a fundamentally different economy than the rest of us," he said. "Distressed communities have had a 15-year recession."
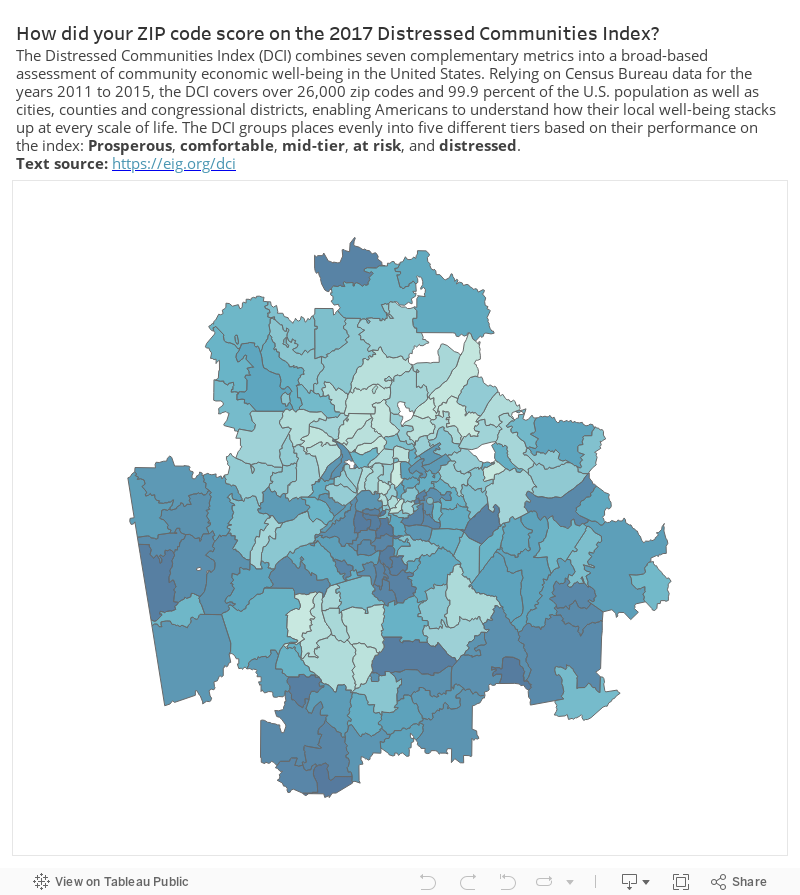
Researchers at EIG collected yearly data from the Census Bureau in a number of categories, from poverty to education to jobs and created a "distress index" to show the economic health of an area.
Then they looked year by year for each area ZIP code — and ranked them.
In Metro Atlanta, the highest ranking ZIP code economically was 30024 in Suwanee. At the bottom was ZIP code 30315, an area mostly south of I-20 and east of I-85.
In 2000, the Suwanee ZIP’s median household income was $86,581. The Atlanta ZIP’s median household income was $20,333.
Fifteen years later, the Suwanee ZIP’s median income had risen to $101,390. The Atlanta ZIP’s median income had barely budged: it was $21,120.
Other measures echo the notion that the Atlanta ZIP has been left behind. More than 22 percent of adults in that area do not have a high school diploma. Roughly 43 percent of its residents are below the poverty line.
In the Suwanee ZIP, 4.5 percent of adults do not have a high school diploma and the poverty rate is just over 5 percent.
Inequality has been an issue for academics and politicians since various studies have shown an increasing share of the national income going to those at the top.
Some economists say that can be a drag on growth, since it concentrates so much of the nation’s income with people who may spend lavishly, but also invest or save much of their money. In contrast, less affluent households often spend every dollar they make.
Critics have rarely suggested the data itself is wrong, but they have sometimes argued that the conclusions are flawed. After all, people can slip into a high-income bracket with one good year – or plunge deep into the lower ranks with a bad one. And then if their luck changes, they can shift up or down.
The more of that mobility there is, the more misleading the data can be – because this year’s 1 percent is not necessarily made up of the same people as last year’s 1 percent.
But with communities, wealth is more “sticky,” Lettieri said: rich areas stay rich and poor ones stay poor. Moreover, communities are clustered – most affluent communities have affluent communities for neighbors.
That means that opportunities are much greater in those areas – so it is much better to be a poor child in a rich community than in a poor one where the chances for success are limited, Lettieri said.
"Proximity to opportunity really, really matters," he said. "It gets harder to believe in the American dream. It's bad for people's faith that they can make it in America."
Benita Dodd, vice president of the conservative think tank Georgia Public Policy Foundation, said she thinks targeted economic development is important in impoverished areas. And she argued that there are ways to inspire children by showing them more options.
The report adds to the reason for charter schools, she said. "When you look at poverty at the ZIP code level and look at the schools, we get an understanding of how the kids are struggling," she said. "Probably the schools in their area are struggling, too."
Of the 197 ZIP codes of the expanded metro region, 30 have poverty rates of more than 25 percent, according to EIG. Thirty-two of the ZIPs have median income of less than $40,000 and seven of those are below $30,000.
The impact of the rich community-poor community gap is not just on the people, but on the future of metro Atlanta, said Wesley Tharpe, research director of the left-leaning Georgia Budget and Policy Institute.
“The economy is at its best when it is allowing full access to opportunity for as many people as possible,” he said. “Extreme inequality undermines that. You need a strong middle class with access to educational opportunities. You need for people lower down to have access to the economic ladder.”
THE SOUTHEAST
Share of ZIP codes that are prosperous:
Florida: 20.1 percent
North Carolina: 19.9 percent
Georgia: 19.5 percent
Tennessee: 18.2 percent
South Carolina: 15.7 percent
Alabama: 11.9 percent
Source: Economic Innovation Group, Census Bureau
Share of ZIP codes that are distressed:
Mississippi: 43 percent
Alabama: 35.8 percent
South Carolina: 30.0 percent
Tennessee: 27.1 percent
Georgia: 25.8 percent
North Carolina: 24.9 percent
Florida: 13.4 percent
Core metro ZIP codes with fastest job growth since 2000
30038 Stonecrest/Lithonia, DeKalb: 394.1 percent
30019 Dacula, Gwinnett: 340.3 percent
30043 Lawrenceville, Gwinnett: 165.5 percent
30519 Buford, Gwinnett: 132.1 percent
30152 Kennesaw, Cobb: 128.6 percent
30294 Ellenwood, DeKalb: 125.8 percent
30044 Lawrenceville, Gwinnett: 124.3 percent
30024 Suwanee, Gwinnett: 112.7 percent
30097 Johns Creek, Fulton 108.0 percent
30022 Johns Creek, Fulton: 105.6 percent
Source: Economic Innovation Group, Census Bureau, staff research
All metro Atlanta ZIP codes, fastest job growth since 2000
30234 Jenkinsburg, Butts: 440.4 percent
30038 Stonecrest/Lithonia, DeKalb: 394.1 percent
30019 Dacula, Gwinnett: 340.3 percent
30620 Bethlehem, Barrow: 295.1 percent
30041 Cumming, Forsyth: 242.3 percent
30157 Dallas, Paulding: 218.7 percent
30277 Sharpsburg, Coweta: 210.5 percent
30145 Euharlee, Bartow: 193.0 percent
30052 Loganville, Walton: 191.5 percent
30107 Ball Ground, Cherokee: 188.8 percent
Source: Economic Innovation Group, Census Bureau, staff research
Core metro ZIP codes with worst metro job losses, 2000-15
30296 Riverdale, Clayton: -61.3 percent
30079 Scottdale, DeKalb: -58.5 percent
30072 Pine Lake, DeKalb: -57.6 percent
30345 Atlanta, DeKalb: -57.1 percent
30087 Stone Mountain, DeKalb: -52.9 percent
30360 Dunwoody, DeKalb: -47.1 percent
30340 Doraville, DeKalb: -43.6 percent
30346 Dunwoody, DeKalb: -38.7 percent
30354 Atlanta , Fulton: -37.7 percent
30083 Stone Mountain, DeKalb: -33.6 percent
30236 Jonesboro, Clayton: -33.2 percent
30035 Decatur, DeKalb: -32.6 percent
Source: Economic Innovation Group, Census Bureau, , staff research
Core metro ZIP codes with largest increase in number of companies
30024 Suwanee, Gwinnett: 178.2 percent
30041 Cumming, Forsyth: 159.9 percent
30038 Stonecrest/Lithonia, DeKalb: 157.7 percent
30519 Buford, Gwinnett: 152.0 percent
30019 Dacula, Gwinnett: 141.5 percent
30317 Atlanta, DeKalb: 139.8 percent
30005 Alpharetta Fulton: 121.7 percent
30097 Johns Creek, Fulton: 119.7 percent
30022 Johns Creek, Fulton: 89.3 percent
30005 Alpharetta, Fulton: 121.7 percent
Source: Economic Innovation Group, staff research
Core metro ZIP codes with largest losses in the number of businesses
30296 Riverdale, Clayton: -52.5 percent
30072 Pine Lake, DeKalb: -43.8 percent
30083 Stone Mountain, DeKalb: -24.3 percent
30274 Riverdale, Clayton: -22.1 percent
30045 Lawrenceville, Gwinnett: -21.8 percent
30340 Doraville, DeKalb: -20.9 percent
30341 Chamblee, DeKalb: -20.6 percent
30067 Marietta, Cobb: -20.0 percent
30087 Stone Mountain, DeKalb: -19.4 percent
30088 Redan DeKalb: -18.3 percent
30035 Decatur, DeKalb: -15.3 percent
30093 Norcross, Gwinnett: -14.5 percent
Source: Economic Innovation Group, staff research