Is Atlanta a segregated community?

A new study by the Urban Institute finds that cities where residents are segregated by race and income are less prosperous than more integrated cities.
To further its point, the Washington, D.C.,-based public policy center ranked the 100 most populous cities in the nation by degree of segregation. Researchers found that areas with higher levels of racial and economic segregation had negative effects on income and educational attainment and were more violent, with black residents getting the worst outcomes.
The costs are real. Researchers determined that if Chicago, which is very segregated, were to improve to the national average in racial integration, incomes for black residents would increase 12.4 percent. Not only that, but the study predicted more Chicagoans would complete a college degree and the city's astronomical homicide rate would drop by 30 percent.
You can find the study here.
So what did the study say about Atlanta?
The metro area is more economically segregated than most cities. Atlanta ranked 38th among the top 100 cities studied. Perhaps not surprisingly, New York City was the most economically stratified city in the study. Eugene, Ore., was the least segregated by income.
Atlanta fares slightly better in terms of black-white segregation, ranking 41st among the most populous metro areas. Milwaukee, Wisc., gets the dubious distinction as most racially segregated, with Newark, N.J.; Saginaw, Mich.; Buffalo, N.Y.; and Peoria, Ill. rounding out the top five. Birmingham, Ala., is the first southern city in the ranking, coming in 6th.
The least segregated city along black-white lines is, again, Eugene, Ore. The fact that the city is 85 percent white and less than 1 percent black may play a role.
When it comes to integrating the city's Latino population, Atlanta ranked almost in the top quartile for the greatest degree of segregation, coming in 26th. But here the scoring was widely spaced, with the top ranked cities (Reading, Penn., and Milwaukee again) appearing much more segregated than the rest of the nation.
The study uses spatial demographic data from 1990 through 2010 to draw its conclusions. Interestingly, Atlanta has become less segregated by income and race over the period, but the city's Latino community has become more segregated as it has grown.
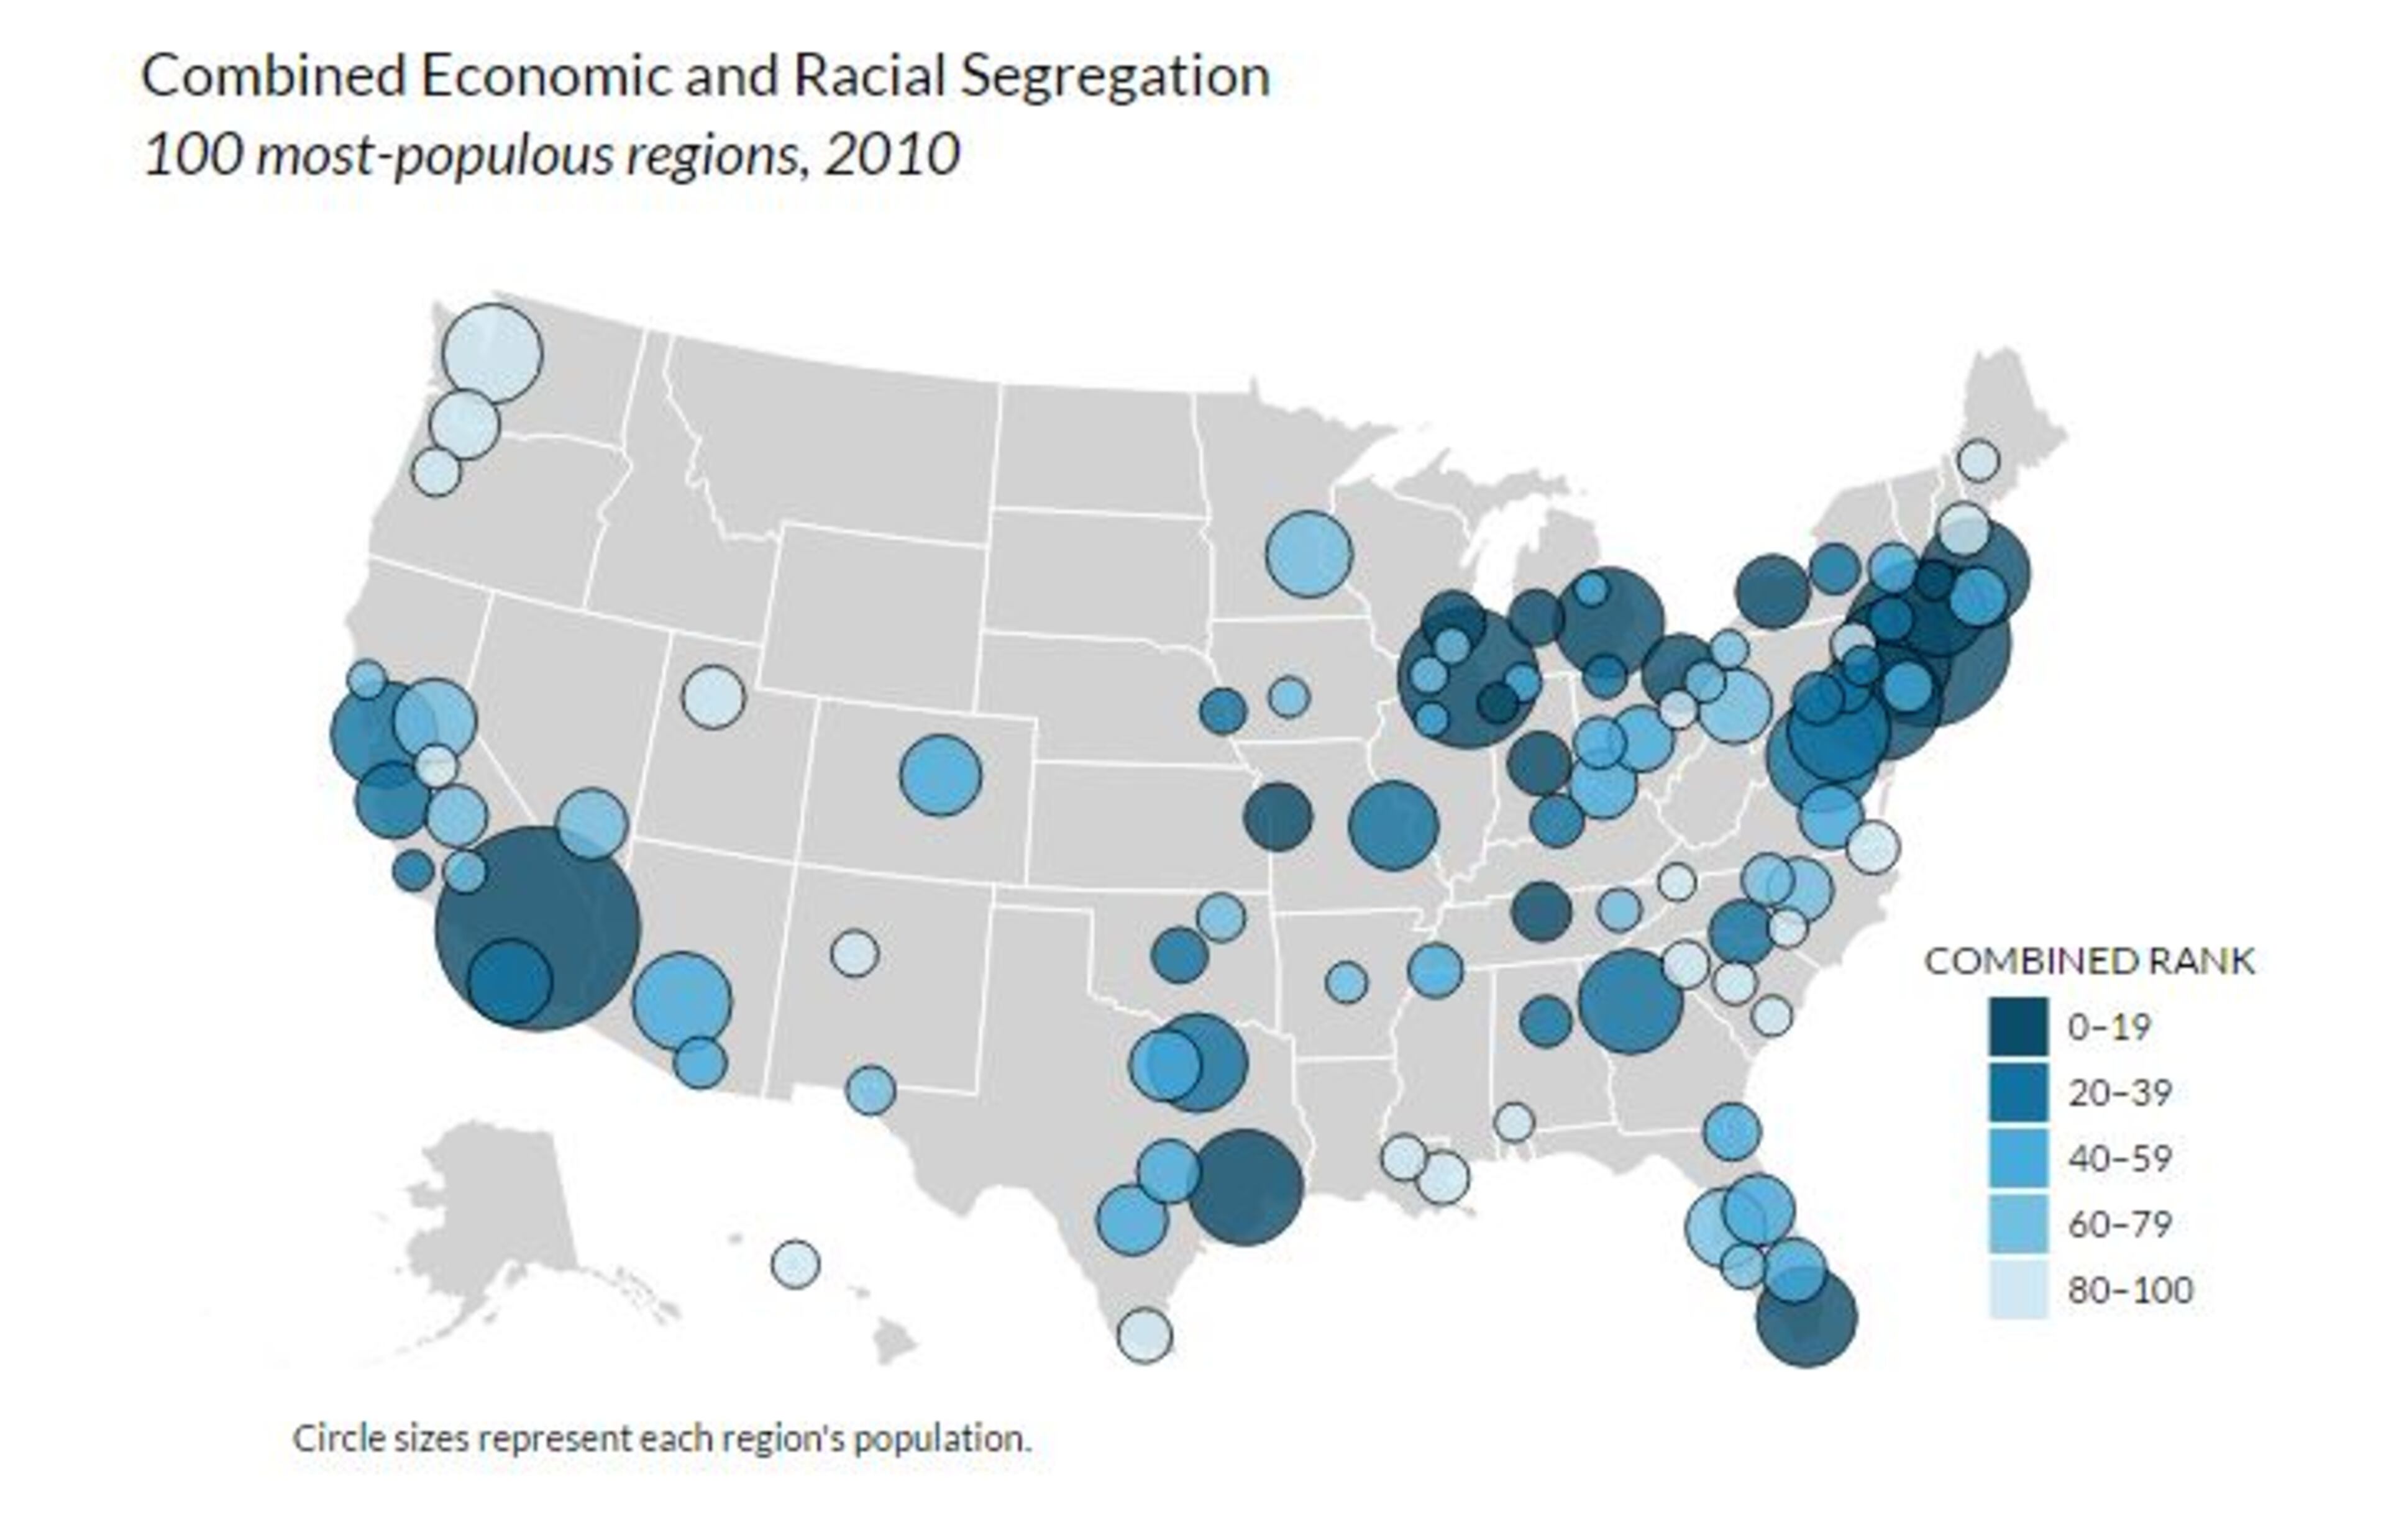
Here's a look at how the study's combined racial and economic segregation data shows up on a map. Darker circles indicate greater segregation. An interactive version of this map is on the institute's website here.


