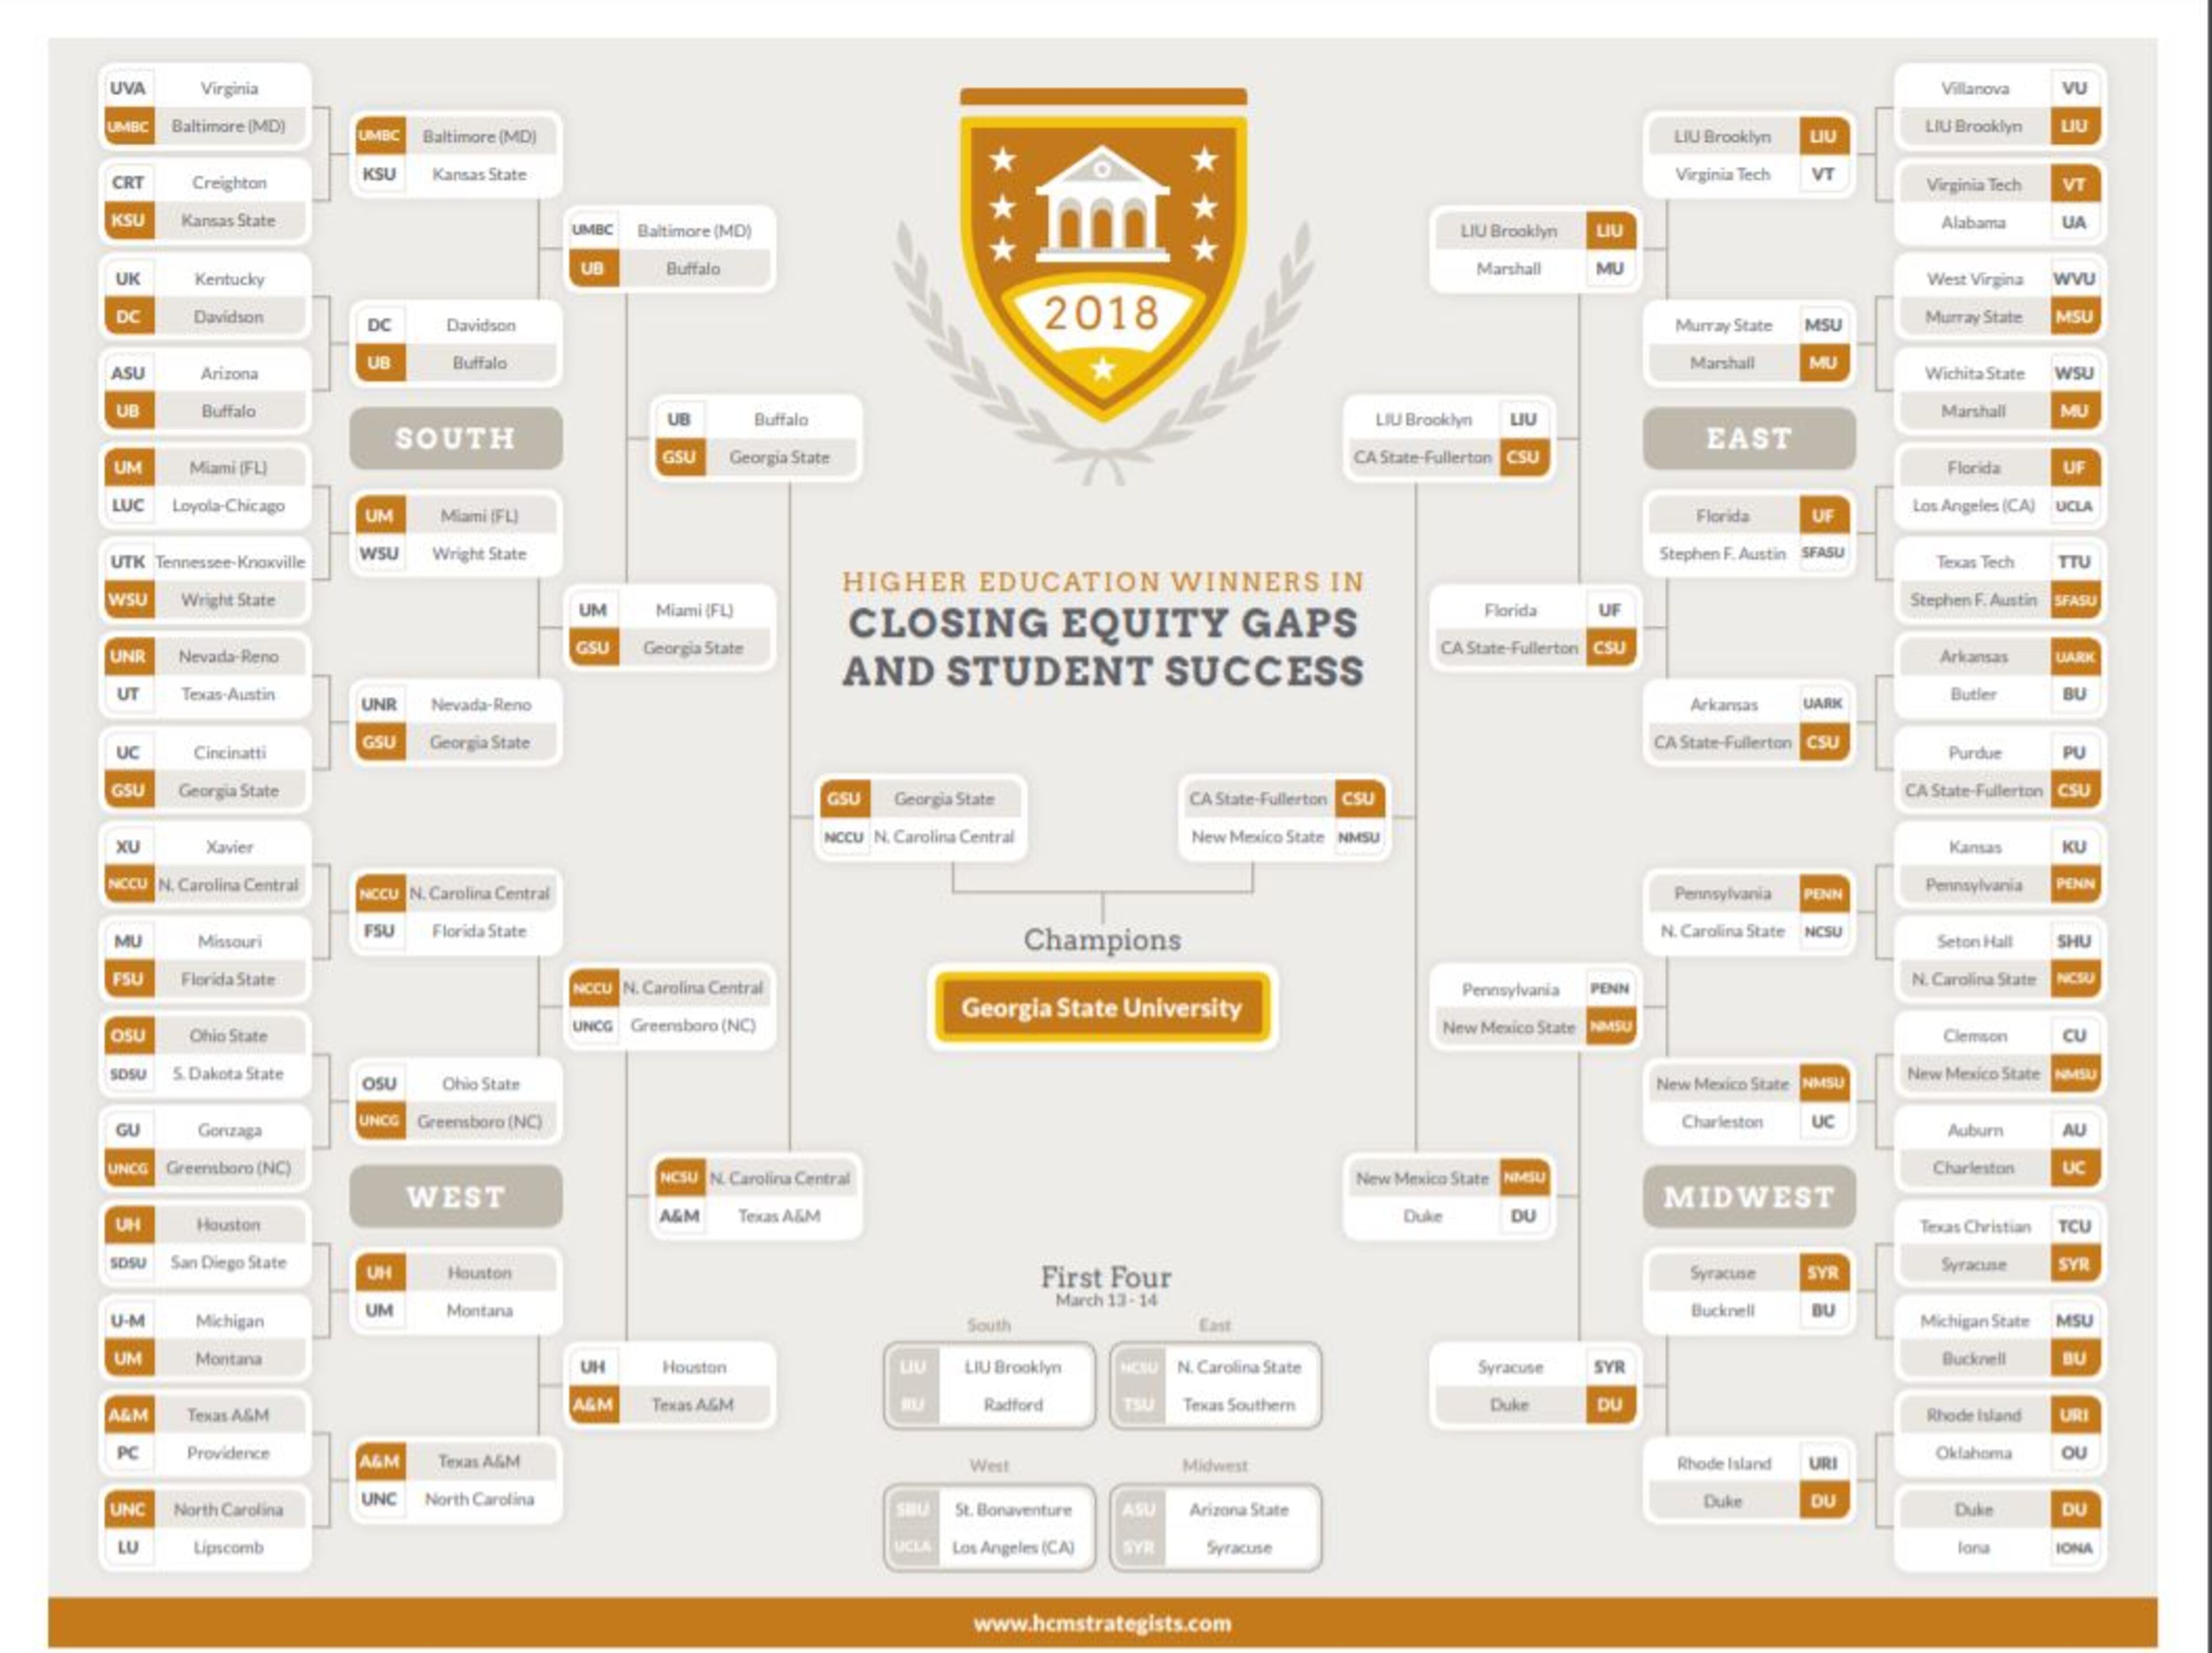
In this March Madness bracket, Georgia State wins for closing gaps

Terrell Halaska is a founding partner of HCM Strategists, a mission-driven public policy firm. Based in Washington, HCM Strategists developed a version of the NCAA basketball brackets focusing on how well the schools serve students, particularly those from traditionally underserved and underrepresented backgrounds, and how well they help those students earn a degree.
In this essay, Halaska, a former U.S. assistant secretary of education for legislation and congressional affairs, says the winner of the bracket is Georgia State University. Martha Snyder, Scott Boelscher and Elizabeth Salinas contributed to the bracket methodology.
By Terrell Halaska
March Madness is here and with it the cultural phenomenon of filling out brackets to pick winning and losing schools in basketball. For one week, people across the country become fascinated with the sport. They pick winners and losers based on arbitrary factors like school colors or mascots, or running an in-depth analysis on each team’s stats. Brackets are filled out with careful precision to ensure a win of the office pool or family competition.
During March Madness the broader public’s attention is focused on basketball at colleges and universities, but what if the focus was taken off sports and put on the schools themselves? What if instead we selected teams based on their track record of closing equity gaps and ensuring student success?
At its best, higher education can help close equity gaps to produce long-term, societal benefit. It is impossible for our nation to achieve the level of educational attainment we need for long term economic success without addressing the current equity gaps. Yet, there are significant deficiencies in how students are supported to succeed and in ways that only perpetuate and exacerbate gaps across student groups.
HCM Strategists, a firm dedicated to advocating for policies that support higher education reform, has developed a methodology -- “Equity and Student Success Index Score” -- by which we filled out our own brackets, using the current list of schools invited to the NCAA tournament. Instead of focusing on athletic prowess, we looked at how well the schools serve students, particularly those from traditionally underserved and underrepresented backgrounds, and how well they help those students earn a degree.
Winning a bracket was based on four factors:
Access Gap: The difference (by percentage) between minority student enrollment and non-minority student enrollment.
Low-Income Students Served: The proportion of students who are Pell Grant recipients.
Graduation Gap: The difference (by percentage) in graduation rates between minority students and non-minority students.
Graduation Rate: The overall graduation rate for all students.
Who is the National Champion?
Our pick for “The Equity and Student Success Title” goes to Georgia State University.

Who else made it to the final four? California State University, Fullerton, outscored New Mexico State to advance to the semi-finals. Georgia State narrowly avoids defeat against North Carolina Central but ultimately advances past Cal State Fullerton to the championship. These four teams all enroll significant percentages of underserved students, including low-income and minority students, and successfully serve these students – with graduation rates above or close to overall rates.
A closer look at the data offers some other standouts from the tournament:
Blue Chip Talent (Low-Income Students Served)
North Carolina Central and Texas Southern lead the pack with 77 percent of its students receiving a Pell Grant; Georgia State is the only school in the final four with at least 50 percent of its students being Pell recipients.
Clutch Performers (Access Gap and Graduation Gap)
North Carolina Central and Georgia State are the only two institutions with negative access and graduation gaps (i.e., these schools enroll more minority students than non-minority students and graduate them at a higher rate).
Traditional Powerhouses (Graduation Rate)
Davidson, Duke, and University of Pennsylvania dominate this area, each coming in with a 95 percent overall graduation rate.
Our index does not take into consideration, for example, affordability or student debt, factors that have significant implications for students and their lives, but it does give underserved students an idea of where they can go to school and have a high degree of confidence that they will get the support they need to succeed.
While our methodology isn’t an exact approach, we want to spark conversation and highlight other areas of higher education that deserve as much, if not more, national discussion and focus.


