Maxwell Round 2 Playoff Projections
Below are the current Maxwell Ratings' playoff projections for each class.
The Maxwell Ratings playoff projections are based on a simulation of the 2014 playoff brackets. The simulation completed 1,000,000 iterations.
While the Maxwell Ratings reflect each team’s strength, the simulation highlights the impact of the playoff brackets.
Class AAAAAA
Playoff Projections by Team
Each team is shown with its region, rating, the number of times making it to the quarterfinals, semifinals, and finals, and the number of times of winning the state championship along with the associated odds.
| Team | Region | Rank | Record | Rating | Draw | Depth | Qtr | Semi | Finals | Champion | Odds |
|---|---|---|---|---|---|---|---|---|---|---|---|
| Colquitt County | R1 - 1 | 1 | (11-0) | 105.83 | 80.55 | 3.21 | 899,890 | 845,932 | 759,698 | 704,620 | 0.42 |
| Lee County | R1 - 3 | 3 | (8-2) | 85.22 | 82.05 | 1.38 | 559,467 | 433,479 | 318,005 | 64,770 | 14.44 |
| Grayson | R8 - 3 | 2 | (10-1) | 88.06 | 86.29 | 1.19 | 590,734 | 437,401 | 93,518 | 63,436 | 14.76 |
| Archer | R8 - 1 | 6 | (8-3) | 82.05 | 82.26 | 1.02 | 440,533 | 322,117 | 220,842 | 38,776 | 24.79 |
| Tucker | R2 - 1 | 5 | (9-2) | 83.61 | 86.71 | 0.76 | 409,266 | 278,317 | 47,490 | 28,406 | 34.20 |
| Westlake | R3 - 1 | 12 | (9-1) | 78.09 | 80.52 | 1.36 | 664,854 | 464,550 | 201,749 | 26,934 | 36.13 |
| Dacula | R8 - 2 | 4 | (10-1) | 84.65 | 88.13 | 0.22 | 100,110 | 63,884 | 33,185 | 20,294 | 48.28 |
| McEachern | R4 - 2 | 10 | (8-3) | 79.14 | 84.56 | 1.00 | 720,713 | 240,355 | 28,655 | 13,853 | 71.19 |
| Milton | R5 - 1 | 9 | (10-1) | 79.75 | 85.49 | 0.70 | 598,928 | 60,876 | 25,205 | 12,819 | 77.01 |
| Hillgrove | R4 - 1 | 17 | (8-3) | 74.10 | 81.24 | 0.96 | 666,634 | 189,192 | 95,268 | 9,441 | 104.93 |
| Central Gwinnett | R8 - 4 | 20 | (7-4) | 72.11 | 81.66 | 0.88 | 584,191 | 225,470 | 63,686 | 4,934 | 201.67 |
| Etowah | R5 - 2 | 21 | (9-2) | 72.02 | 82.70 | 0.58 | 335,146 | 187,588 | 55,164 | 4,415 | 225.48 |
| Hughes | R3 - 2 | 15 | (9-2) | 76.52 | 87.11 | 0.44 | 401,072 | 29,307 | 9,731 | 4,112 | 242.20 |
| Newton | R2 - 3 | 26 | (6-3) | 67.93 | 82.56 | 0.57 | 415,809 | 122,392 | 26,331 | 1,455 | 686.24 |
| Roswell | R5 - 3 | 25 | (8-3) | 67.95 | 83.76 | 0.41 | 333,366 | 55,212 | 18,955 | 1,049 | 952.03 |
| Alpharetta | R6 - 1 | 24 | (10-1) | 68.88 | 86.35 | 0.33 | 279,287 | 43,927 | 2,519 | 685 | 1,459.19 |
Playoff Projections by Region
Each region is shown with the number of times of winning the state championship along with the associated odds.
| Region | Champion | Odds |
|---|---|---|
| 1-AAAAAA | 769,390 | 0.30 |
| 8-AAAAAA | 127,440 | 6.85 |
| 3-AAAAAA | 31,046 | 31.21 |
| 2-AAAAAA | 29,861 | 32.49 |
| 4-AAAAAA | 23,294 | 41.93 |
| 5-AAAAAA | 18,283 | 53.69 |
| 6-AAAAAA | 685 | 1,459.19 |
Modal Bracket
Although any specific bracket is highly unlikely, the modal bracket represents the most probable of all the possible brackets. The modal bracket assumes every favorite wins.

Class AAAAA
Playoff Projections by Team
Each team is shown with its region, rating, the number of times making it to the quarterfinals, semifinals, and finals, and the number of times of winning the state championship along with the associated odds.
| Team | Region | Rank | Record | Rating | Draw | Depth | Qtr | Semi | Finals | Champion | Odds |
|---|---|---|---|---|---|---|---|---|---|---|---|
| Allatoona | R5 - 1 | 1 | (11-0) | 82.06 | 68.91 | 2.27 | 747,816 | 670,204 | 505,072 | 345,283 | 1.90 |
| Ware County | R3 - 1 | 2 | (11-0) | 80.52 | 69.78 | 2.01 | 702,452 | 567,595 | 467,194 | 277,365 | 2.61 |
| Creekside | R6 - 1 | 4 | (9-2) | 72.25 | 70.12 | 1.44 | 773,293 | 426,455 | 166,294 | 78,671 | 11.71 |
| Northside (Warner Robins) | R2 - 1 | 5 | (10-1) | 72.16 | 70.54 | 1.19 | 635,063 | 355,546 | 137,987 | 65,004 | 14.38 |
| Mays | R6 - 3 | 3 | (9-2) | 72.71 | 72.87 | 0.66 | 297,548 | 191,064 | 124,769 | 49,574 | 19.17 |
| Coffee | R3 - 2 | 6 | (10-1) | 71.97 | 72.37 | 0.58 | 252,184 | 187,792 | 96,501 | 43,699 | 21.88 |
| Houston County | R2 - 2 | 8 | (9-2) | 67.48 | 68.58 | 1.34 | 754,174 | 416,267 | 130,286 | 38,185 | 25.19 |
| Kell | R7 - 1 | 7 | (11-0) | 67.66 | 70.76 | 0.88 | 601,088 | 162,046 | 91,753 | 28,573 | 34.00 |
| Stephenson | R6 - 2 | 11 | (8-3) | 66.51 | 70.43 | 0.98 | 564,145 | 304,457 | 89,594 | 24,641 | 39.58 |
| Dalton | R7 - 2 | 9 | (9-2) | 67.40 | 73.25 | 0.58 | 364,937 | 158,445 | 44,779 | 15,911 | 61.85 |
| Stockbridge | R4 - 1 | 14 | (9-2) | 63.15 | 70.39 | 0.70 | 435,855 | 206,792 | 50,240 | 11,563 | 85.48 |
| Jones County | R2 - 3 | 13 | (9-2) | 64.34 | 72.64 | 0.52 | 398,912 | 79,296 | 35,955 | 8,420 | 117.76 |
| Harris County | R1 - 1 | 15 | (9-2) | 61.37 | 70.71 | 0.66 | 550,329 | 83,971 | 24,217 | 6,121 | 162.37 |
| Gainesville | R8 - 2 | 19 | (9-2) | 60.13 | 71.91 | 0.53 | 449,671 | 58,033 | 14,564 | 3,233 | 308.32 |
| Glynn Academy | R3 - 3 | 18 | (8-3) | 60.76 | 74.13 | 0.30 | 226,707 | 59,555 | 10,586 | 2,391 | 417.31 |
| Sequoyah | R7 - 4 | 26 | (6-5) | 57.05 | 72.32 | 0.33 | 245,826 | 72,484 | 10,208 | 1,366 | 731.24 |
Playoff Projections by Region
Each region is shown with the number of times of winning the state championship along with the associated odds.
| Region | Champion | Odds |
|---|---|---|
| 5-AAAAA | 345,283 | 1.90 |
| 3-AAAAA | 323,454 | 2.09 |
| 6-AAAAA | 152,887 | 5.54 |
| 2-AAAAA | 111,610 | 7.96 |
| 7-AAAAA | 45,850 | 20.81 |
| 4-AAAAA | 11,563 | 85.48 |
| 1-AAAAA | 6,121 | 162.37 |
| 8-AAAAA | 3,233 | 308.32 |
Modal Bracket
Although any specific bracket is highly unlikely, the modal bracket represents the most probable of all the possible brackets. The modal bracket assumes every favorite wins.

Class AAAA
Playoff Projections by Team
Each team is shown with its region, rating, the number of times making it to the quarterfinals, semifinals, and finals, and the number of times of winning the state championship along with the associated odds.
| Team | Region | Rank | Record | Rating | Draw | Depth | Qtr | Semi | Finals | Champion | Odds |
|---|---|---|---|---|---|---|---|---|---|---|---|
| Buford | R8 - 1 | 1 | (11-0) | 92.01 | 67.05 | 3.30 | 945,163 | 859,181 | 776,595 | 722,570 | 0.38 |
| Woodward Academy | R5 - 1 | 5 | (9-2) | 69.05 | 66.06 | 1.83 | 852,331 | 559,890 | 355,196 | 63,930 | 14.64 |
| Cartersville | R7 - 1 | 3 | (10-1) | 70.77 | 68.85 | 1.46 | 839,026 | 488,736 | 83,449 | 52,015 | 18.23 |
| St. Pius X | R6 - 1 | 7 | (9-2) | 66.35 | 63.34 | 1.93 | 914,667 | 636,353 | 325,706 | 48,738 | 19.52 |
| Sandy Creek | R5 - 2 | 4 | (10-1) | 70.42 | 69.80 | 1.38 | 827,641 | 438,755 | 69,323 | 41,425 | 23.14 |
| Marist | R6 - 2 | 2 | (10-1) | 71.00 | 73.79 | 0.72 | 577,861 | 76,467 | 40,085 | 24,493 | 39.83 |
| Cairo | R1 - 1 | 10 | (9-2) | 62.60 | 68.29 | 0.81 | 502,250 | 203,066 | 98,217 | 11,179 | 88.45 |
| North Oconee | R8 - 2 | 9 | (8-3) | 63.29 | 69.09 | 0.81 | 497,750 | 200,262 | 96,814 | 10,947 | 90.35 |
| Griffin | R4 - 1 | 6 | (11-0) | 67.08 | 73.81 | 0.50 | 422,139 | 44,065 | 19,749 | 10,593 | 93.40 |
| West Laurens | R2 - 1 | 12 | (8-3) | 59.75 | 65.11 | 0.94 | 612,065 | 235,001 | 84,019 | 7,667 | 129.42 |
| Mary Persons | R2 - 2 | 8 | (9-2) | 64.32 | 75.19 | 0.09 | 54,837 | 20,287 | 7,444 | 3,361 | 296.53 |
| Stephens County | R8 - 3 | 13 | (8-3) | 55.97 | 68.26 | 0.53 | 387,935 | 112,867 | 29,372 | 1,802 | 553.99 |
| Burke County | R3 - 2 | 18 | (7-4) | 52.30 | 71.20 | 0.19 | 147,669 | 36,782 | 9,156 | 418 | 2,390.10 |
| Baldwin | R2 - 3 | 15 | (7-4) | 55.04 | 74.50 | 0.20 | 160,974 | 36,171 | 1,676 | 418 | 2,391.22 |
| Wayne County | R3 - 1 | 17 | (6-5) | 53.95 | 72.98 | 0.21 | 172,359 | 36,338 | 1,679 | 412 | 2,424.22 |
| Eastside | R4 - 2 | 33 | (7-4) | 43.41 | 69.98 | 0.10 | 85,333 | 15,779 | 1,520 | 31 | 32,525.24 |
Playoff Projections by Region
Each region is shown with the number of times of winning the state championship along with the associated odds.
| Region | Champion | Odds |
|---|---|---|
| 8-AAAA | 735,319 | 0.36 |
| 5-AAAA | 105,355 | 8.49 |
| 6-AAAA | 73,231 | 12.66 |
| 7-AAAA | 52,015 | 18.23 |
| 2-AAAA | 11,446 | 86.36 |
| 1-AAAA | 11,179 | 88.45 |
| 4-AAAA | 10,624 | 93.13 |
| 3-AAAA | 831 | 1,203.02 |
Modal Bracket
Although any specific bracket is highly unlikely, the modal bracket represents the most probable of all the possible brackets. The modal bracket assumes every favorite wins.
Class AAA
Playoff Projections by Team
Each team is shown with its region, rating, the number of times making it to the quarterfinals, semifinals, and finals, and the number of times of winning the state championship along with the associated odds.
| Team | Region | Rank | Record | Rating | Draw | Depth | Qtr | Semi | Finals | Champion | Odds |
|---|---|---|---|---|---|---|---|---|---|---|---|
| Washington County | R3 - 1 | 1 | (11-0) | 81.15 | 62.27 | 2.80 | 971,168 | 896,676 | 543,521 | 383,809 | 1.61 |
| Calhoun | R6 - 1 | 3 | (11-0) | 76.75 | 64.02 | 2.53 | 874,352 | 779,082 | 608,891 | 267,360 | 2.74 |
| Blessed Trinity | R4 - 1 | 2 | (11-0) | 79.06 | 69.31 | 2.01 | 911,976 | 600,646 | 297,335 | 197,636 | 4.06 |
| Jefferson | R8 - 1 | 4 | (11-0) | 74.42 | 68.71 | 1.42 | 839,969 | 359,815 | 140,804 | 79,621 | 11.56 |
| Westminster (Atlanta) | R4 - 3 | 5 | (10-1) | 66.96 | 70.02 | 1.08 | 594,355 | 340,458 | 123,089 | 27,001 | 36.04 |
| Hart County | R8 - 2 | 6 | (10-1) | 64.71 | 69.98 | 0.95 | 565,619 | 279,464 | 90,086 | 16,645 | 59.08 |
| Central (Carrollton) | R5 - 1 | 8 | (11-0) | 62.36 | 70.08 | 0.67 | 405,645 | 198,544 | 58,038 | 9,461 | 104.69 |
| Cook | R1 - 1 | 9 | (9-2) | 61.29 | 70.14 | 0.67 | 434,381 | 181,534 | 49,806 | 7,444 | 133.34 |
| Pierce County | R1 - 2 | 10 | (9-2) | 58.70 | 65.10 | 0.91 | 804,711 | 87,545 | 12,595 | 2,946 | 338.48 |
| Elbert County | R8 - 3 | 14 | (8-3) | 57.35 | 67.67 | 0.69 | 569,791 | 91,462 | 29,364 | 2,938 | 339.33 |
| Cedar Grove | R4 - 2 | 12 | (9-2) | 58.13 | 69.39 | 0.22 | 125,648 | 70,410 | 24,542 | 2,636 | 378.37 |
| Appling County | R1 - 4 | 16 | (8-3) | 55.32 | 68.85 | 0.51 | 430,209 | 59,046 | 16,184 | 1,354 | 737.50 |
| Dodge County | R1 - 3 | 11 | (9-2) | 58.62 | 75.81 | 0.19 | 160,031 | 23,141 | 3,091 | 704 | 1,418.57 |
| Adairsville | R6 - 2 | 15 | (10-1) | 56.46 | 75.87 | 0.11 | 88,024 | 16,398 | 1,898 | 379 | 2,636.57 |
| Callaway | R5 - 2 | 18 | (7-4) | 46.76 | 71.76 | 0.04 | 28,832 | 8,522 | 437 | 40 | 24,764.74 |
| Oconee County | R8 - 4 | 19 | (8-3) | 45.32 | 71.50 | 0.20 | 195,289 | 7,257 | 320 | 25 | 40,213.77 |
Playoff Projections by Region
Each region is shown with the number of times of winning the state championship along with the associated odds.
| Region | Champion | Odds |
|---|---|---|
| 3-AAA | 383,809 | 1.61 |
| 6-AAA | 267,739 | 2.73 |
| 4-AAA | 227,273 | 3.40 |
| 8-AAA | 99,229 | 9.08 |
| 1-AAA | 12,448 | 79.34 |
| 5-AAA | 9,502 | 104.24 |
Modal Bracket
Although any specific bracket is highly unlikely, the modal bracket represents the most probable of all the possible brackets. The modal bracket assumes every favorite wins.
Class AA
Playoff Projections by Team
Each team is shown with its region, rating, the number of times making it to the quarterfinals, semifinals, and finals, and the number of times of winning the state championship along with the associated odds.
| Team | Region | Rank | Record | Rating | Draw | Depth | Qtr | Semi | Finals | Champion | Odds |
|---|---|---|---|---|---|---|---|---|---|---|---|
| Vidalia | R2 - 1 | 1 | (11-0) | 76.63 | 56.77 | 2.33 | 985,685 | 577,558 | 435,864 | 327,714 | 2.05 |
| Benedictine | R2 - 2 | 3 | (9-2) | 70.32 | 58.28 | 2.42 | 944,486 | 714,473 | 539,909 | 221,888 | 3.51 |
| Greater Atlanta Christian | R6 - 1 | 2 | (11-0) | 74.21 | 63.10 | 1.86 | 933,454 | 417,770 | 296,247 | 209,270 | 3.78 |
| Fitzgerald | R1 - 1 | 4 | (10-1) | 66.95 | 53.97 | 2.24 | 951,478 | 878,028 | 262,816 | 144,143 | 5.94 |
| Brooks County | R1 - 2 | 5 | (8-3) | 61.08 | 50.72 | 2.14 | 937,789 | 829,917 | 300,639 | 67,287 | 13.86 |
| Lovett | R6 - 2 | 6 | (8-3) | 60.52 | 64.17 | 0.91 | 601,328 | 183,850 | 101,603 | 21,807 | 44.86 |
| Macon County | R4 - 1 | 8 | (9-2) | 55.63 | 64.42 | 0.54 | 398,672 | 92,928 | 42,778 | 6,654 | 149.29 |
| Screven County | R3 - 1 | 13 | (10-1) | 41.90 | 57.50 | 0.87 | 730,074 | 125,122 | 11,526 | 537 | 1,859.56 |
| Jefferson County | R3 - 2 | 11 | (8-3) | 44.29 | 61.89 | 0.69 | 616,803 | 71,441 | 2,917 | 349 | 2,865.97 |
| Lamar County | R4 - 2 | 9 | (8-2-1) | 48.58 | 70.47 | 0.07 | 66,546 | 4,233 | 816 | 138 | 7,240.80 |
| Rabun County | R8 - 1 | 15 | (9-2) | 41.20 | 65.14 | 0.07 | 55,514 | 8,749 | 1,738 | 76 | 13,166.04 |
| Pace Academy | R6 - 4 | 18 | (6-5) | 40.31 | 63.48 | 0.42 | 383,197 | 32,094 | 896 | 72 | 13,907.57 |
| Model | R7 - 3 | 19 | (9-2) | 37.97 | 66.32 | 0.07 | 48,522 | 18,437 | 411 | 27 | 37,255.84 |
| Washington-Wilkes | R8 - 4 | 29 | (7-4) | 34.73 | 62.43 | 0.09 | 62,211 | 23,037 | 985 | 22 | 46,145.31 |
| Heard County | R5 - 2 | 31 | (6-5) | 32.73 | 60.76 | 0.29 | 269,926 | 21,924 | 821 | 15 | 66,797.58 |
| Coosa | R7 - 2 | 27 | (8-3) | 35.09 | 70.47 | 0.01 | 14,315 | 439 | 32 | 2 | 579,821.66 |
Playoff Projections by Region
Each region is shown with the number of times of winning the state championship along with the associated odds.
| Region | Champion | Odds |
|---|---|---|
| 2-AA | 549,601 | 0.82 |
| 6-AA | 231,149 | 3.33 |
| 1-AA | 211,430 | 3.73 |
| 4-AA | 6,792 | 146.24 |
| 3-AA | 886 | 1,127.32 |
| 8-AA | 98 | 10,243.07 |
| 7-AA | 29 | 35,006.42 |
| 5-AA | 15 | 66,797.58 |
Modal Bracket
Although any specific bracket is highly unlikely, the modal bracket represents the most probable of all the possible brackets. The modal bracket assumes every favorite wins.

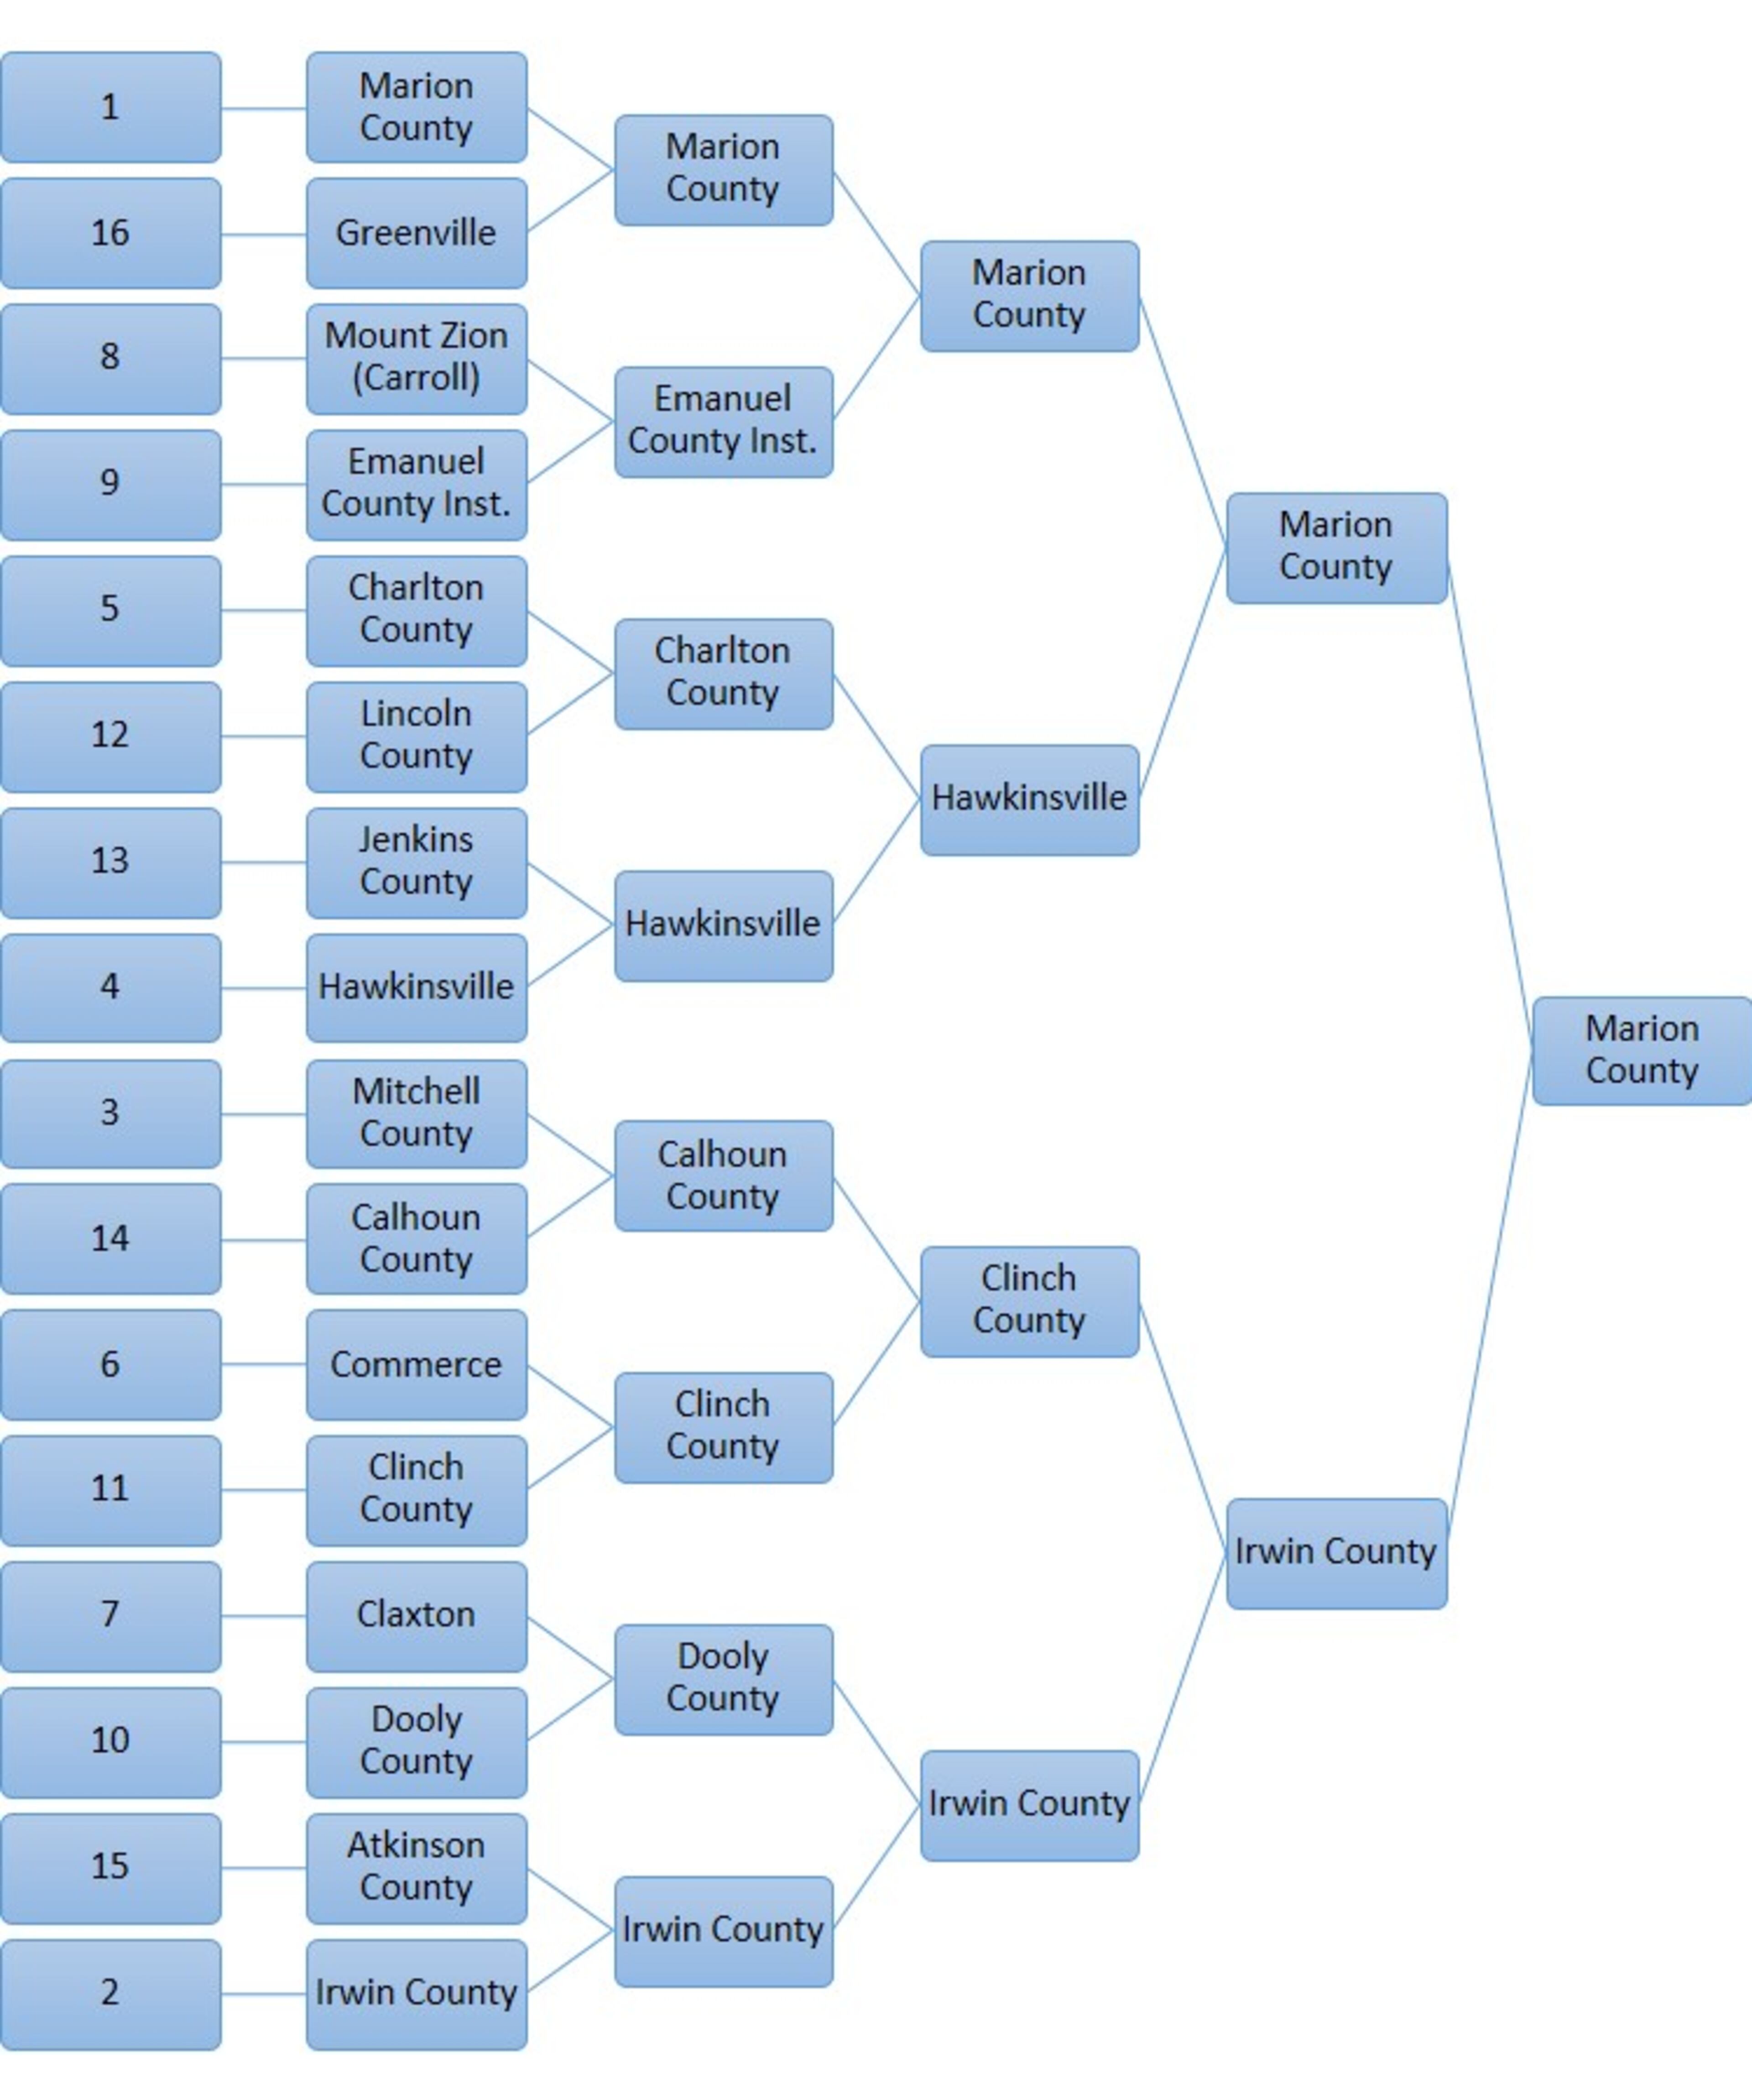
Class A - Public
Playoff Projections by Team
Each team is shown with its region, rating, the number of times making it to the quarterfinals, semifinals, and finals, and the number of times of winning the state championship along with the associated odds.
| Team | Region | Rank | Record | Rating | Draw | Depth | Qtr | Semi | Finals | Champion | Odds |
|---|---|---|---|---|---|---|---|---|---|---|---|
| Marion County | R4 - 1 | 1 | (10-0) | 61.13 | 45.03 | 2.70 | 933,205 | 844,586 | 546,318 | 373,591 | 1.68 |
| Irwin County | R2 - 2 | 3 | (8-1-1) | 58.53 | 43.25 | 2.58 | 897,799 | 740,451 | 630,161 | 312,633 | 2.20 |
| Hawkinsville | R4 - 4 | 4 | (9-1) | 57.67 | 46.41 | 2.11 | 965,974 | 652,689 | 306,631 | 180,181 | 4.55 |
| Charlton County | R2 - 5 | 6 | (9-1) | 52.64 | 50.41 | 1.39 | 877,611 | 332,308 | 121,260 | 58,118 | 16.21 |
| Clinch County | R2 - 11 | 13 | (6-4) | 45.05 | 41.36 | 1.77 | 823,174 | 706,002 | 197,401 | 39,853 | 24.09 |
| Dooly County | R4 - 10 | 11 | (7-3) | 46.03 | 48.41 | 1.01 | 692,323 | 180,849 | 115,076 | 25,017 | 38.97 |
| Emanuel County Institute | R3 - 9 | 15 | (8-2) | 41.16 | 50.69 | 0.72 | 610,639 | 90,273 | 16,665 | 4,268 | 233.29 |
| Claxton | R3 - 7 | 18 | (7-3) | 37.14 | 50.24 | 0.37 | 307,677 | 43,125 | 19,067 | 2,039 | 489.54 |
| Atkinson County | R2 - 15 | 17 | (6-4) | 37.58 | 51.55 | 0.15 | 102,201 | 35,575 | 15,079 | 1,661 | 601.17 |
| Mount Zion (Carroll) | R6 - 8 | 20 | (7-3) | 35.88 | 51.05 | 0.43 | 389,361 | 38,783 | 4,654 | 832 | 1,200.62 |
| Greenville | R4 - 16 | 21 | (5-5) | 35.54 | 52.99 | 0.10 | 66,795 | 26,358 | 3,059 | 501 | 1,993.32 |
| Calhoun County | R1 - 14 | 34 | (7-3) | 28.59 | 45.91 | 0.69 | 561,684 | 116,963 | 9,474 | 468 | 2,133.96 |
| Commerce | R8 - 6 | 33 | (8-2) | 28.89 | 47.80 | 0.28 | 176,826 | 96,444 | 8,504 | 438 | 2,282.54 |
| Mitchell County | R1 - 3 | 38 | (6-4) | 25.33 | 45.69 | 0.52 | 438,316 | 80,591 | 5,238 | 209 | 4,786.87 |
| Lincoln County | R7 - 12 | 23 | (7-3) | 33.72 | 55.71 | 0.14 | 122,389 | 12,199 | 1,271 | 183 | 5,472.94 |
| Jenkins County | R3 - 13 | 39 | (7-3) | 24.99 | 55.96 | 0.04 | 34,026 | 2,804 | 143 | 10 | 98,969.09 |
Playoff Projections by Region
Each region is shown with the number of times of winning the state championship along with the associated odds.
| Region | Champion | Odds |
|---|---|---|
| 4-A | 579,289 | 0.73 |
| 2-A | 412,264 | 1.43 |
| 3-A | 6,317 | 157.30 |
| 6-A | 832 | 1,200.62 |
| 1-A | 677 | 1,475.55 |
| 8-A | 438 | 2,282.54 |
| 7-A | 183 | 5,472.94 |
Modal Bracket
Although any specific bracket is highly unlikely, the modal bracket represents the most probable of all the possible brackets. The modal bracket assumes every favorite wins.
Class A - Private
Playoff Projections by Team
Each team is shown with its region, rating, the number of times making it to the quarterfinals, semifinals, and finals, and the number of times of winning the state championship along with the associated odds.
| Team | Region | Rank | Record | Rating | Draw | Depth | Qtr | Semi | Finals | Champion | Odds |
|---|---|---|---|---|---|---|---|---|---|---|---|
| Mount Paran Christian | R6 - 3 | 2 | (10-0) | 60.98 | 44.71 | 2.69 | 934,441 | 741,624 | 593,243 | 421,355 | 1.37 |
| Calvary Day | R3 - 1 | 5 | (10-0) | 55.68 | 41.52 | 2.55 | 946,242 | 723,662 | 579,461 | 298,273 | 2.35 |
| Aquinas | R7 - 2 | 7 | (10-0) | 49.40 | 43.56 | 1.87 | 883,191 | 664,891 | 221,065 | 101,734 | 8.83 |
| Eagle's Landing Christian | R5 - 5 | 12 | (4-6) | 45.62 | 41.79 | 1.87 | 869,892 | 698,151 | 233,543 | 65,142 | 14.35 |
| Savannah Christian | R3 - 6 | 8 | (9-1) | 49.37 | 49.75 | 0.87 | 587,345 | 154,733 | 88,474 | 39,866 | 24.08 |
| Landmark Christian | R5 - 8 | 10 | (8-2) | 46.10 | 47.84 | 0.94 | 617,275 | 181,890 | 107,527 | 30,403 | 31.89 |
| Pacelli | R4 - 11 | 9 | (7-3) | 46.62 | 50.58 | 0.57 | 412,655 | 90,434 | 45,097 | 17,326 | 56.72 |
| Tattnall Square | R7 - 7 | 16 | (9-1) | 41.03 | 47.45 | 0.99 | 699,517 | 239,271 | 40,791 | 11,350 | 87.11 |
| Mount Pisgah Christian | R6 - 9 | 14 | (7-3) | 42.10 | 48.87 | 0.52 | 382,725 | 86,445 | 43,437 | 9,365 | 105.78 |
| First Presbyterian | R7 - 13 | 24 | (7-3) | 33.55 | 45.82 | 0.78 | 595,078 | 161,040 | 21,597 | 2,373 | 420.34 |
| Pinecrest Academy | R6 - 10 | 25 | (7-3) | 33.36 | 49.82 | 0.37 | 300,483 | 62,794 | 5,758 | 901 | 1,109.25 |
| Prince Avenue Christian | R8 - 4 | 32 | (8-2) | 28.92 | 46.22 | 0.50 | 404,922 | 88,922 | 8,595 | 666 | 1,500.71 |
| Stratford Academy | R7 - 14 | 22 | (6-4) | 35.19 | 52.22 | 0.08 | 65,559 | 13,209 | 3,397 | 608 | 1,643.10 |
| Athens Christian | R8 - 12 | 37 | (7-3) | 27.40 | 46.91 | 0.19 | 130,108 | 51,887 | 4,123 | 266 | 3,756.60 |
| St. Francis | R6 - 15 | 31 | (7-3) | 29.95 | 51.29 | 0.15 | 116,809 | 33,044 | 2,175 | 257 | 3,892.02 |
| Christian Heritage | R6 - 16 | 36 | (5-5) | 27.78 | 50.06 | 0.06 | 53,758 | 8,003 | 1,717 | 114 | 8,747.17 |
Playoff Projections by Region
Each region is shown with the number of times of winning the state championship along with the associated odds.
| Region | Champion | Odds |
|---|---|---|
| 6-A | 431,992 | 1.31 |
| 3-A | 338,140 | 1.96 |
| 7-A | 116,065 | 7.62 |
| 5-A | 95,545 | 9.47 |
| 4-A | 17,326 | 56.72 |
| 8-A | 932 | 1,071.92 |
Modal Bracket
Although any specific bracket is highly unlikely, the modal bracket represents the most probable of all the possible brackets. The modal bracket assumes every favorite wins.