Maxwell Round 1 Playoff Projections
Below are the current Maxwell Ratings' playoff projections for each class.
The Maxwell Ratings playoff projections are based on a simulation of the 2014 playoff brackets. The simulation completed 1,000,000 iterations.
While the Maxwell Ratings reflect each team’s strength, the simulation highlights the impact of the playoff brackets.
Class AAAAAA
Playoff Projections by Team
Each team is shown with its region, rating, the number of times making it to the quarterfinals, semifinals, and finals, and the number of times of winning the state championship along with the associated odds.
| Team | Region | Rank | Record | Rating | Draw | Depth | 2nd | Qtr | Semi | Finals | Champion | Odds |
|---|---|---|---|---|---|---|---|---|---|---|---|---|
| Colquitt County | R1-1 | 1 | 10-0 | 108.51 | 72.65 | 4.51 | 998,353 | 949,541 | 907,765 | 860,597 | 794,140 | 0.26 |
| Valdosta | R1-2 | 2 | 9-1 | 87.93 | 78.54 | 2.57 | 966,366 | 656,928 | 522,835 | 355,436 | 65,846 | 14.19 |
| Lee County | R1-3 | 3 | 7-2 | 86.18 | 81.44 | 2.22 | 825,922 | 600,533 | 481,890 | 265,562 | 43,799 | 21.83 |
| North Gwinnett | R7-1 | 6 | 8-2 | 81.50 | 77.82 | 1.52 | 835,895 | 320,971 | 222,440 | 121,773 | 15,902 | 61.88 |
| Mill Creek | R7-2 | 4 | 7-3 | 82.87 | 84.99 | 1.12 | 547,358 | 320,563 | 217,216 | 24,725 | 12,039 | 82.06 |
| Milton | R5-1 | 9 | 9-1 | 79.85 | 77.56 | 1.70 | 955,084 | 656,580 | 50,762 | 26,345 | 11,361 | 87.02 |
| McEachern | R4-2 | 10 | 7-3 | 79.42 | 80.49 | 1.77 | 811,533 | 631,391 | 292,097 | 26,148 | 10,649 | 92.91 |
| Grayson | R8-3 | 5 | 9-1 | 81.85 | 85.80 | 0.89 | 452,642 | 253,815 | 162,881 | 17,148 | 7,710 | 128.70 |
| Archer | R8-1 | 12 | 7-3 | 77.75 | 82.08 | 1.15 | 658,136 | 255,012 | 168,869 | 65,988 | 6,702 | 148.20 |
| Tift County | R1-4 | 8 | 7-3 | 80.95 | 85.56 | 0.98 | 559,467 | 247,197 | 153,288 | 15,109 | 6,395 | 155.38 |
| Westlake | R3-1 | 15 | 8-1 | 75.72 | 74.92 | 1.60 | 841,975 | 533,128 | 155,810 | 64,993 | 5,721 | 173.79 |
| Dacula | R8-2 | 7 | 9-1 | 81.30 | 84.99 | 0.73 | 651,128 | 37,995 | 22,116 | 11,945 | 5,379 | 184.91 |
| Hillgrove | R4-1 | 16 | 7-3 | 74.27 | 77.96 | 1.71 | 836,443 | 601,274 | 205,533 | 65,242 | 5,168 | 192.49 |
| Tucker | R2-1 | 13 | 8-2 | 77.68 | 84.80 | 0.73 | 440,533 | 178,425 | 103,930 | 8,720 | 3,335 | 298.89 |
| Etowah | R5-2 | 19 | 8-2 | 72.13 | 78.07 | 1.48 | 931,884 | 422,130 | 89,614 | 29,772 | 1,898 | 525.85 |
| North Cobb | R4-3 | 17 | 7-3 | 73.67 | 84.82 | 0.72 | 521,736 | 186,234 | 7,985 | 2,766 | 765 | 1,306.69 |
| Peachtree Ridge | R7-3 | 14 | 7-3 | 75.94 | 86.71 | 0.37 | 348,872 | 12,414 | 5,549 | 2,205 | 707 | 1,413.63 |
| Norcross | R7-4 | 20 | 7-3 | 72.08 | 84.49 | 0.48 | 341,864 | 83,531 | 42,291 | 10,613 | 650 | 1,537.75 |
| Roswell | R5-3 | 23 | 7-3 | 67.84 | 79.38 | 1.21 | 810,920 | 317,101 | 66,119 | 12,193 | 536 | 1,863.56 |
| Hughes | R3-2 | 21 | 8-2 | 71.92 | 84.57 | 0.64 | 478,264 | 153,283 | 5,803 | 1,866 | 474 | 2,107.80 |
| Lovejoy | R2-2 | 22 | 7-3 | 69.73 | 84.20 | 0.27 | 174,078 | 60,924 | 28,397 | 6,238 | 329 | 3,035.86 |
| Alpharetta | R6-1 | 24 | 9-1 | 67.58 | 80.63 | 0.80 | 577,373 | 179,238 | 38,858 | 1,492 | 289 | 3,456.03 |
| East Coweta | R3-3 | 26 | 8-2 | 65.70 | 83.81 | 0.29 | 188,467 | 89,239 | 15,481 | 465 | 71 | 14,034.75 |
| Cherokee | R5-4 | 27 | 7-3 | 65.34 | 83.00 | 0.54 | 422,627 | 100,132 | 16,249 | 469 | 69 | 14,583.92 |
| Central Gwinnett | R8-4 | 25 | 6-4 | 66.10 | 85.33 | 0.19 | 164,105 | 18,870 | 5,837 | 1,221 | 46 | 21,862.20 |
| Douglas County | R3-4 | 33 | 5-5 | 58.83 | 84.63 | 0.23 | 163,557 | 55,604 | 5,366 | 471 | 9 | 108,054.33 |
| North Paulding | R4-4 | 31 | 4-6 | 59.87 | 83.40 | 0.20 | 158,025 | 39,492 | 2,904 | 374 | 8 | 123,614.18 |
| Lambert | R6-2 | 42 | 7-3 | 52.40 | 81.87 | 0.22 | 189,080 | 26,021 | 1,536 | 79 | 1 | 1,115,630.18 |
| Newton | R2-3 | 37 | 5-3 | 55.23 | 85.63 | 0.04 | 33,634 | 3,231 | 443 | 40 | 1 | 1,747,529.20 |
| Northview | R6-4 | 44 | 7-3 | 50.16 | 86.54 | 0.05 | 44,916 | 3,903 | 19 | 1 | 27,595,628.28 | |
| South Forsyth | R6-3 | 48 | 6-4 | 46.85 | 83.71 | 0.07 | 68,116 | 5,250 | 117 | 5 | 31,427,673.92 | |
| Rockdale County | R2-4 | 50 | 5-5 | 45.32 | 87.23 | 0.00 | 1,647 | 50 | 2 | 679,946,259.28 |
Playoff Projections by Region
Each region is shown with the number of times of winning the state championship along with the associated odds.
| Region | Champion | Odds |
|---|---|---|
| 1-AAAAAA | 910,180 | 0.10 |
| 7-AAAAAA | 29,298 | 33.13 |
| 5-AAAAAA | 13,864 | 71.13 |
| 4-AAAAAA | 16,590 | 59.28 |
| 8-AAAAAA | 19,837 | 49.41 |
| 3-AAAAAA | 6,276 | 158.34 |
| 2-AAAAAA | 3,664 | 271.90 |
| 6-AAAAAA | 290 | 3,444.55 |
Region versus Region
| Matchup | Projection | 4-0 | 3-1 | 2-2 | 1-3 | 0-4 |
|---|---|---|---|---|---|---|
| 1-AAAAAA versus 2-AAAAAA | 3.35 - 0.65 | 44.6% | 46.1% | 9.0% | 0.3% | 0.0% |
| 3-AAAAAA versus 4-AAAAAA | 1.67 - 2.33 | 1.2% | 13.3% | 42.5% | 37.3% | 5.6% |
| 5-AAAAAA versus 6-AAAAAA | 3.12 - 0.88 | 30.5% | 52.4% | 15.7% | 1.3% | 0.0% |
| 7-AAAAAA versus 8-AAAAAA | 2.07 - 1.93 | 5.5% | 26.3% | 41.7% | 23.4% | 3.2% |
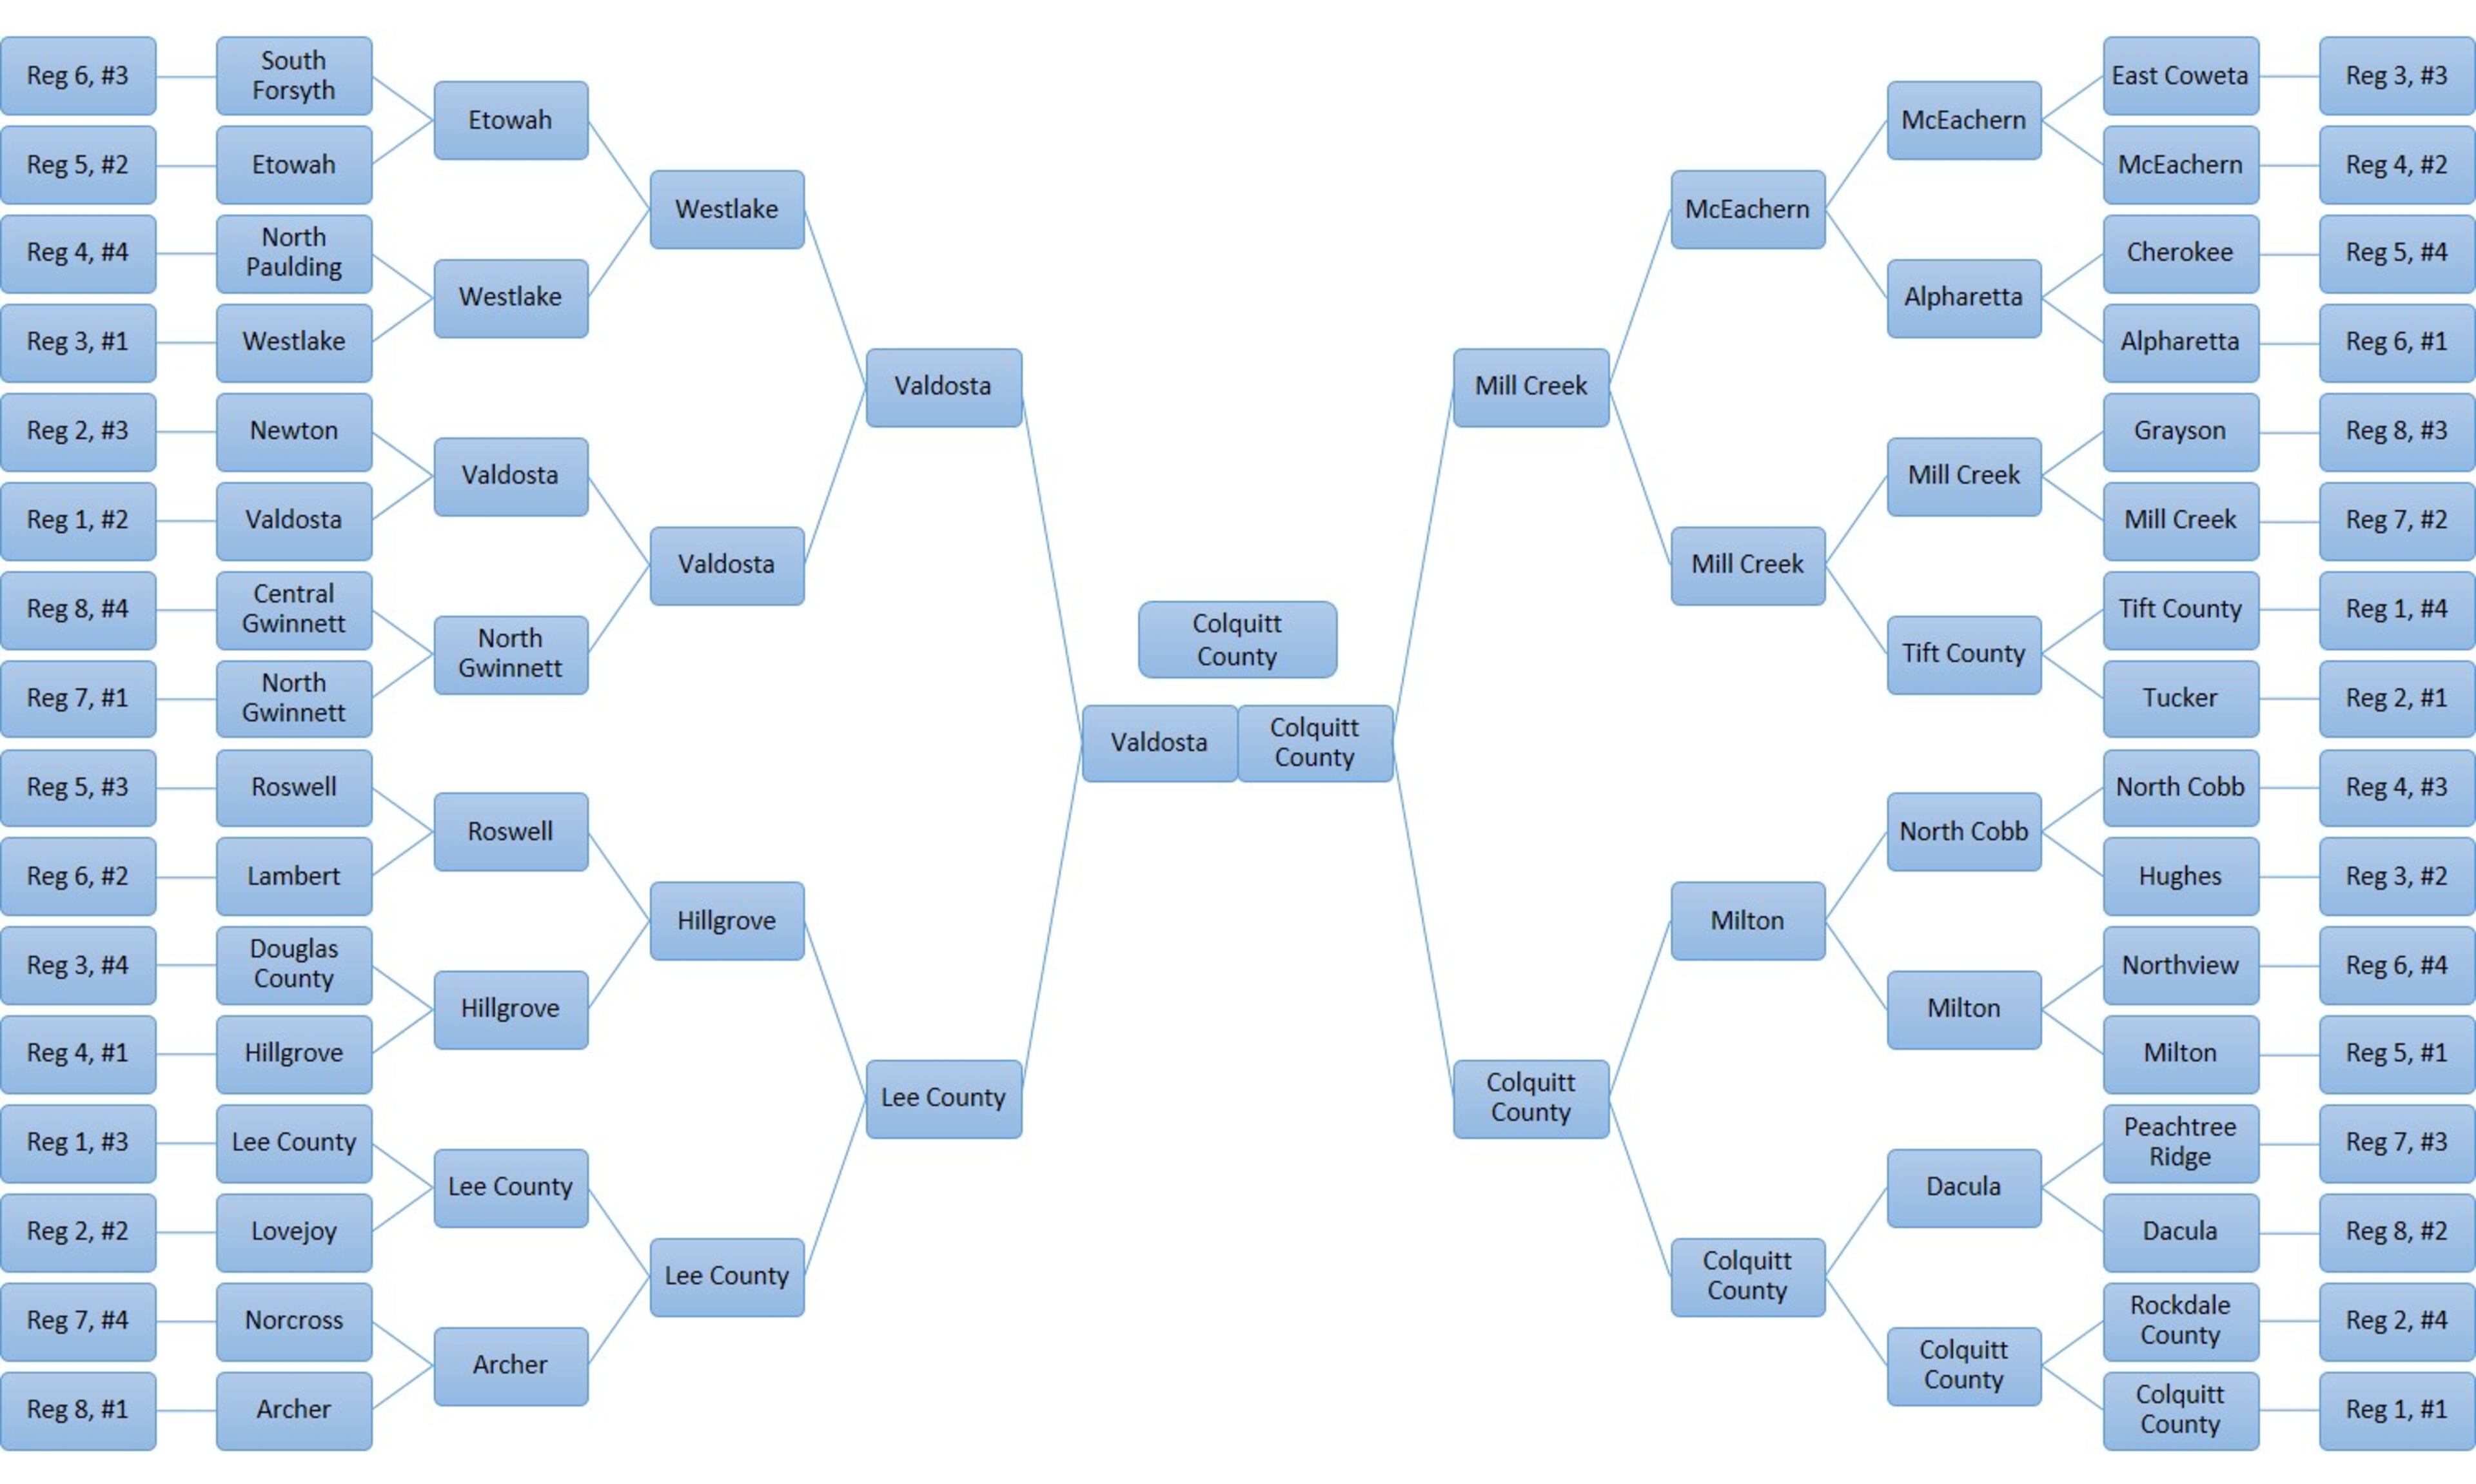
Modal Bracket
Although any specific bracket is highly unlikely, the modal bracket represents the most probable of all the possible brackets. The modal bracket assumes every favorite wins.
Class AAAAA
Playoff Projections by Team
Each team is shown with its region, rating, the number of times making it to the quarterfinals, semifinals, and finals, and the number of times of winning the state championship along with the associated odds.
| Team | Region | Rank | Record | Rating | Draw | Depth | 2nd | Qtr | Semi | Finals | Champion | Odds |
|---|---|---|---|---|---|---|---|---|---|---|---|---|
| Allatoona | R5-1 | 1 | 10-0 | 88.57 | 63.83 | 3.88 | 964,974 | 863,731 | 812,797 | 682,570 | 557,829 | 0.79 |
| Ware County | R3-1 | 2 | 10-0 | 78.49 | 67.44 | 2.57 | 947,549 | 636,565 | 491,865 | 353,804 | 139,302 | 6.18 |
| Northside (Warner Robins) | R2-1 | 3 | 9-1 | 75.63 | 60.82 | 2.51 | 985,036 | 716,397 | 539,451 | 169,967 | 96,021 | 9.41 |
| Alexander | R5-3 | 5 | 8-2 | 72.74 | 69.15 | 1.99 | 789,680 | 621,022 | 366,782 | 165,333 | 44,775 | 21.33 |
| Houston County | R2-2 | 6 | 8-2 | 71.09 | 65.89 | 2.24 | 943,214 | 686,917 | 399,365 | 167,856 | 41,302 | 23.21 |
| South Paulding | R5-2 | 4 | 8-2 | 74.24 | 72.63 | 1.32 | 695,720 | 280,518 | 190,673 | 117,776 | 35,082 | 27.50 |
| Kell | R7-1 | 12 | 10-0 | 67.40 | 67.33 | 1.67 | 898,348 | 526,211 | 159,791 | 74,932 | 15,303 | 64.35 |
| Coffee | R3-2 | 7 | 9-1 | 69.65 | 69.94 | 1.07 | 813,361 | 118,181 | 82,292 | 36,767 | 15,068 | 65.37 |
| Dalton | R7-2 | 10 | 8-2 | 67.75 | 68.47 | 1.40 | 916,215 | 278,610 | 161,187 | 30,508 | 11,209 | 88.22 |
| Jones County | R2-3 | 11 | 8-2 | 67.46 | 70.83 | 1.28 | 733,020 | 382,741 | 107,898 | 47,562 | 9,144 | 108.36 |
| New Manchester | R5-4 | 8 | 6-4 | 67.95 | 71.55 | 1.07 | 517,743 | 383,198 | 135,169 | 25,461 | 9,065 | 109.31 |
| Creekside | R6-1 | 14 | 8-2 | 66.36 | 70.58 | 0.99 | 482,257 | 358,505 | 123,124 | 22,473 | 7,899 | 125.60 |
| Lanier | R8-1 | 17 | 10-0 | 62.73 | 66.23 | 1.09 | 708,477 | 250,004 | 99,818 | 26,193 | 3,848 | 258.89 |
| Mays | R6-3 | 13 | 8-2 | 66.85 | 74.70 | 0.44 | 304,280 | 77,666 | 38,676 | 16,499 | 3,041 | 327.83 |
| Stockbridge | R4-1 | 22 | 8-2 | 61.00 | 68.37 | 1.12 | 767,099 | 246,540 | 87,257 | 20,255 | 2,614 | 381.59 |
| Harris County | R1-1 | 19 | 8-2 | 61.85 | 68.91 | 0.84 | 498,000 | 296,452 | 31,786 | 9,357 | 2,445 | 407.99 |
| Warner Robins | R2-4 | 15 | 6-4 | 62.81 | 70.11 | 0.83 | 502,000 | 289,476 | 30,515 | 8,904 | 2,258 | 441.93 |
| Gainesville | R8-2 | 21 | 8-2 | 61.15 | 68.86 | 1.15 | 749,885 | 352,885 | 33,592 | 8,992 | 2,135 | 467.40 |
| Stephenson | R6-2 | 24 | 7-3 | 58.63 | 71.42 | 0.35 | 210,320 | 103,046 | 29,766 | 5,496 | 554 | 1,803.97 |
| Glynn Academy | R3-3 | 25 | 7-3 | 57.02 | 71.45 | 0.66 | 499,000 | 132,912 | 21,229 | 1,875 | 312 | 3,201.50 |
| Drew | R4-2 | 28 | 7-3 | 56.18 | 71.11 | 0.65 | 501,000 | 125,385 | 19,254 | 1,632 | 265 | 3,774.86 |
| Carver (Columbus) | R1-2 | 26 | 8-2 | 56.48 | 72.46 | 0.36 | 266,980 | 76,670 | 9,536 | 2,180 | 185 | 5,415.88 |
| Sequoyah | R7-4 | 31 | 5-5 | 54.73 | 71.06 | 0.36 | 291,523 | 53,714 | 11,824 | 1,522 | 109 | 9,201.54 |
| Mundy's Mill | R4-3 | 29 | 7-3 | 55.81 | 73.26 | 0.20 | 186,639 | 9,357 | 3,384 | 602 | 91 | 11,001.95 |
| Carver (Atlanta) | R6-4 | 27 | 8-2 | 56.29 | 73.62 | 0.05 | 35,026 | 8,731 | 3,192 | 580 | 89 | 11,180.40 |
| Creekview | R7-3 | 34 | 6-4 | 51.05 | 71.38 | 0.31 | 250,115 | 61,187 | 2,443 | 295 | 30 | 33,564.28 |
| Brunswick | R3-4 | 36 | 6-4 | 49.96 | 71.82 | 0.27 | 232,901 | 29,392 | 4,284 | 365 | 17 | 58,176.16 |
| Starr's Mill | R4-4 | 35 | 6-4 | 50.43 | 75.08 | 0.06 | 52,451 | 5,252 | 864 | 114 | 6 | 178,127.98 |
| Winder-Barrow | R8-4 | 41 | 6-4 | 46.49 | 73.66 | 0.12 | 101,652 | 14,378 | 697 | 66 | 2 | 441,480.28 |
| LaGrange | R1-3 | 46 | 5-5 | 43.87 | 71.89 | 0.07 | 56,786 | 9,365 | 904 | 45 | 1 | 812,593.49 |
| Salem | R8-3 | 44 | 6-4 | 44.71 | 73.59 | 0.09 | 83,785 | 4,235 | 548 | 17 | 1 | 1,010,769.11 |
| Northside (Columbus) | R1-4 | 63 | 4-6 | 34.64 | 73.86 | 0.02 | 14,964 | 758 | 38 | 100,431,381.65 |
Playoff Projections by Region
Each region is shown with the number of times of winning the state championship along with the associated odds.
| Region | Champion | Odds |
|---|---|---|
| 5-AAAAA | 646,751 | 0.55 |
| 3-AAAAA | 154,699 | 5.46 |
| 2-AAAAA | 148,725 | 5.72 |
| 7-AAAAA | 26,650 | 36.52 |
| 6-AAAAA | 11,583 | 85.33 |
| 8-AAAAA | 5,986 | 166.06 |
| 4-AAAAA | 2,975 | 335.13 |
| 1-AAAAA | 2,631 | 379.10 |
Region versus Region
| Matchup | Projection | 4-0 | 3-1 | 2-2 | 1-3 | 0-4 |
|---|---|---|---|---|---|---|
| 1-AAAAA versus 2-AAAAA | 0.84 - 3.16 | 0.0% | 1.0% | 15.9% | 48.9% | 34.2% |
| 3-AAAAA versus 4-AAAAA | 2.49 - 1.51 | 9.0% | 41.0% | 40.7% | 8.9% | 0.4% |
| 5-AAAAA versus 6-AAAAA | 2.97 - 1.03 | 27.4% | 45.9% | 22.8% | 3.7% | 0.1% |
| 7-AAAAA versus 8-AAAAA | 2.36 - 1.64 | 6.0% | 33.8% | 50.5% | 9.3% | 0.5% |
Modal Bracket
Although any specific bracket is highly unlikely, the modal bracket represents the most probable of all the possible brackets. The modal bracket assumes every favorite wins.

Class AAAA
Playoff Projections by Team
Each team is shown with its region, rating, the number of times making it to the quarterfinals, semifinals, and finals, and the number of times of winning the state championship along with the associated odds.
| Team | Region | Rank | Record | Rating | Draw | Depth | 2nd | Qtr | Semi | Finals | Champion | Odds |
|---|---|---|---|---|---|---|---|---|---|---|---|---|
| Buford | R8-1 | 1 | 10-0 | 91.07 | 58.23 | 4.33 | 995,517 | 943,523 | 882,318 | 779,151 | 727,862 | 0.37 |
| Cartersville | R7-1 | 2 | 9-1 | 73.29 | 62.11 | 2.49 | 952,438 | 799,845 | 538,409 | 113,705 | 80,936 | 11.36 |
| Woodward Academy | R5-1 | 4 | 8-2 | 67.57 | 55.42 | 2.83 | 965,710 | 873,817 | 545,074 | 382,558 | 63,143 | 14.84 |
| Sandy Creek | R5-2 | 3 | 9-1 | 69.80 | 64.28 | 2.14 | 876,749 | 792,681 | 371,963 | 59,261 | 36,650 | 26.29 |
| Cairo | R1-1 | 5 | 8-2 | 65.67 | 61.45 | 1.97 | 849,156 | 592,982 | 300,977 | 199,325 | 28,778 | 33.75 |
| St. Pius X | R6-1 | 11 | 8-2 | 61.40 | 57.91 | 1.99 | 742,882 | 665,314 | 400,328 | 161,949 | 17,014 | 57.77 |
| West Laurens | R2-1 | 10 | 7-3 | 61.49 | 61.55 | 1.72 | 732,237 | 524,709 | 317,296 | 129,018 | 13,649 | 72.27 |
| Griffin | R4-1 | 6 | 10-0 | 65.53 | 63.04 | 1.62 | 970,316 | 555,686 | 55,673 | 21,748 | 11,718 | 84.34 |
| North Oconee | R8-2 | 12 | 7-3 | 60.27 | 64.96 | 1.25 | 755,470 | 310,558 | 114,934 | 59,953 | 5,386 | 184.68 |
| Mary Persons | R2-2 | 8 | 8-2 | 64.66 | 68.78 | 0.87 | 785,161 | 51,212 | 25,171 | 8,880 | 4,418 | 225.35 |
| Marist | R6-2 | 7 | 9-1 | 64.70 | 70.39 | 0.92 | 597,486 | 282,316 | 24,814 | 8,775 | 4,374 | 227.62 |
| Worth County | R1-2 | 13 | 6-3 | 59.28 | 68.88 | 0.85 | 654,753 | 140,682 | 50,543 | 3,787 | 1,410 | 708.28 |
| Pickens | R7-2 | 15 | 8-2 | 54.35 | 64.00 | 0.96 | 603,244 | 229,226 | 99,334 | 24,086 | 1,325 | 753.74 |
| Whitewater | R5-3 | 9 | 7-3 | 61.63 | 71.46 | 0.58 | 402,514 | 160,911 | 10,925 | 3,092 | 1,310 | 762.21 |
| Fayette County | R5-4 | 20 | 4-6 | 51.67 | 63.45 | 0.52 | 257,118 | 188,606 | 65,773 | 12,878 | 547 | 1,827.87 |
| Bainbridge | R1-4 | 18 | 6-4 | 52.31 | 65.81 | 0.45 | 267,763 | 123,209 | 47,289 | 9,722 | 437 | 2,287.93 |
| Stephens County | R8-3 | 22 | 7-3 | 51.04 | 65.08 | 0.57 | 396,756 | 122,855 | 44,544 | 8,329 | 335 | 2,984.51 |
| Baldwin | R2-3 | 16 | 6-4 | 53.76 | 70.52 | 0.41 | 345,247 | 49,948 | 12,564 | 590 | 152 | 6,574.55 |
| Burke County | R3-2 | 28 | 6-4 | 47.56 | 63.57 | 0.76 | 653,849 | 87,322 | 16,652 | 4,154 | 125 | 7,998.53 |
| Gilmer | R7-3 | 23 | 8-2 | 49.87 | 67.45 | 0.31 | 244,530 | 52,757 | 10,156 | 2,929 | 106 | 9,428.74 |
| Columbia | R6-3 | 21 | 7-3 | 51.06 | 68.45 | 0.21 | 123,251 | 73,471 | 10,336 | 385 | 81 | 12,277.95 |
| Veterans | R2-4 | 25 | 3-7 | 49.27 | 67.85 | 0.20 | 150,844 | 43,703 | 8,043 | 2,200 | 75 | 13,283.22 |
| Wayne County | R3-1 | 27 | 5-5 | 48.30 | 64.97 | 0.72 | 609,688 | 94,372 | 11,661 | 375 | 69 | 14,468.35 |
| Eastside | R4-2 | 32 | 6-4 | 42.54 | 61.12 | 0.81 | 675,682 | 114,154 | 21,954 | 2,078 | 39 | 25,489.86 |
| Westover | R1-3 | 17 | 6-4 | 52.58 | 71.72 | 0.22 | 214,839 | 4,887 | 1,071 | 156 | 37 | 27,061.73 |
| Locust Grove | R4-3 | 33 | 8-2 | 42.08 | 65.12 | 0.38 | 346,151 | 30,490 | 3,633 | 592 | 10 | 96,101.47 |
| Eagle's Landing | R4-4 | 30 | 8-2 | 44.72 | 67.58 | 0.43 | 390,312 | 39,476 | 3,281 | 69 | 9 | 114,882.57 |
| White County | R8-4 | 31 | 6-4 | 44.20 | 71.46 | 0.06 | 47,562 | 9,524 | 1,243 | 25 | 3 | 332,586.34 |
| Thomson | R3-3 | 44 | 4-6 | 36.08 | 62.87 | 0.36 | 324,318 | 31,926 | 3,482 | 181 | 2 | 557,515.23 |
| Lithonia | R6-4 | 47 | 6-4 | 35.07 | 66.49 | 0.04 | 34,290 | 8,371 | 530 | 47 | 2,380,915.67 | |
| Southeast Whitfield | R7-4 | 39 | 6-4 | 37.92 | 72.07 | 0.00 | 4,483 | 377 | 23 | 1 | 15,362,595.37 | |
| Liberty County | R3-4 | 51 | 4-6 | 31.54 | 72.15 | 0.03 | 29,684 | 1,087 | 5 | 234,851,364.49 |
Playoff Projections by Region
Each region is shown with the number of times of winning the state championship along with the associated odds.
| Region | Champion | Odds |
|---|---|---|
| 8-AAAA | 733,585 | 0.36 |
| 5-AAAA | 101,650 | 8.84 |
| 7-AAAA | 82,367 | 11.14 |
| 1-AAAA | 30,662 | 31.61 |
| 6-AAAA | 21,470 | 45.58 |
| 2-AAAA | 18,294 | 53.66 |
| 4-AAAA | 11,776 | 83.92 |
| 3-AAAA | 196 | 5,103.20 |
Region versus Region
| Matchup | Projection | 4-0 | 3-1 | 2-2 | 1-3 | 0-4 |
|---|---|---|---|---|---|---|
| 1-AAAA versus 2-AAAA | 1.99 - 2.01 | 3.2% | 22.7% | 46.7% | 24.4% | 3.0% |
| 3-AAAA versus 4-AAAA | 1.62 - 2.38 | 0.4% | 13.8% | 41.9% | 35.1% | 8.9% |
| 5-AAAA versus 6-AAAA | 2.50 - 1.50 | 8.8% | 39.9% | 44.4% | 6.8% | 0.2% |
| 7-AAAA versus 8-AAAA | 1.80 - 2.20 | 0.1% | 14.2% | 53.2% | 31.0% | 1.4% |
Modal Bracket
Although any specific bracket is highly unlikely, the modal bracket represents the most probable of all the possible brackets. The modal bracket assumes every favorite wins.

Class AAA
Playoff Projections by Team
Each team is shown with its region, rating, the number of times making it to the quarterfinals, semifinals, and finals, and the number of times of winning the state championship along with the associated odds.
| Team | Region | Rank | Record | Rating | Draw | Depth | 2nd | Qtr | Semi | Finals | Champion | Odds |
|---|---|---|---|---|---|---|---|---|---|---|---|---|
| Peach County | R2-1 | 1 | 10-0 | 85.25 | 62.62 | 3.49 | 986,494 | 945,894 | 623,380 | 563,742 | 371,384 | 1.69 |
| Washington County | R3-1 | 2 | 10-0 | 81.05 | 56.26 | 3.80 | 989,260 | 958,024 | 925,091 | 620,999 | 309,708 | 2.23 |
| Calhoun | R6-1 | 3 | 10-0 | 79.53 | 54.77 | 2.78 | 997,230 | 938,918 | 367,574 | 309,706 | 162,858 | 5.14 |
| Blessed Trinity | R4-1 | 4 | 10-0 | 76.09 | 55.81 | 2.64 | 997,569 | 839,869 | 507,458 | 213,563 | 83,110 | 11.03 |
| Jefferson | R8-1 | 5 | 10-0 | 73.43 | 61.58 | 2.08 | 994,541 | 627,801 | 308,877 | 112,404 | 37,643 | 25.57 |
| Westside (Macon) | R2-2 | 6 | 9-1 | 70.15 | 71.18 | 1.48 | 912,376 | 366,044 | 145,675 | 41,582 | 10,813 | 91.48 |
| Central (Carrollton) | R5-1 | 7 | 9-0 | 64.52 | 62.57 | 1.94 | 961,948 | 568,383 | 352,073 | 50,500 | 10,494 | 94.29 |
| Hart County | R8-2 | 9 | 9-1 | 63.03 | 61.73 | 2.09 | 959,379 | 729,708 | 347,806 | 41,011 | 7,102 | 139.80 |
| Westminster (Atlanta) | R4-3 | 8 | 9-1 | 63.88 | 67.03 | 1.51 | 838,214 | 403,584 | 229,877 | 29,085 | 5,357 | 185.67 |
| Adairsville | R6-2 | 10 | 9-1 | 60.66 | 67.71 | 1.17 | 962,203 | 159,699 | 37,532 | 5,885 | 784 | 1,275.26 |
| Cook | R1-1 | 13 | 8-2 | 52.41 | 59.78 | 1.15 | 837,263 | 250,139 | 63,365 | 3,148 | 239 | 4,189.02 |
| Elbert County | R8-3 | 11 | 7-3 | 55.33 | 67.33 | 0.99 | 929,759 | 50,245 | 5,188 | 1,590 | 144 | 6,965.70 |
| West Hall | R7-1 | 17 | 9-1 | 48.61 | 63.41 | 1.12 | 723,122 | 375,071 | 22,177 | 1,779 | 93 | 10,721.21 |
| Cedar Grove | R4-2 | 12 | 8-2 | 53.51 | 67.52 | 0.97 | 907,207 | 60,038 | 3,714 | 1,041 | 81 | 12,399.31 |
| Ringgold | R6-3 | 14 | 8-2 | 49.60 | 66.03 | 0.68 | 636,221 | 29,384 | 15,444 | 1,226 | 64 | 15,558.32 |
| Pierce County | R1-2 | 16 | 7-2 | 48.65 | 66.19 | 0.82 | 517,743 | 283,300 | 15,932 | 1,187 | 58 | 17,138.73 |
| Jackson | R2-3 | 15 | 7-3 | 48.80 | 66.55 | 0.76 | 482,257 | 265,588 | 14,884 | 1,098 | 54 | 18,639.20 |
| Laney | R3-2 | 19 | 7-3 | 46.57 | 70.01 | 0.19 | 161,786 | 25,558 | 5,574 | 149 | 6 | 162,496.64 |
| Callaway | R5-2 | 21 | 6-3 | 43.15 | 66.84 | 0.38 | 363,779 | 9,949 | 3,792 | 170 | 5 | 197,440.84 |
| Oconee County | R8-4 | 22 | 7-3 | 39.87 | 67.91 | 0.36 | 276,878 | 76,041 | 2,065 | 66 | 1 | 714,345.19 |
| Dodge County | R1-3 | 18 | 8-2 | 47.58 | 76.09 | 0.09 | 87,624 | 6,085 | 453 | 29 | 1 | 784,971.61 |
| Appling County | R1-4 | 20 | 7-3 | 43.20 | 76.10 | 0.02 | 13,506 | 3,448 | 130 | 15 | 2,193,537.19 | |
| Maynard Jackson | R4-4 | 24 | 7-3 | 36.68 | 69.38 | 0.01 | 10,740 | 2,644 | 614 | 14 | 4,434,318.28 | |
| Central (Macon) | R2-4 | 23 | 5-5 | 36.89 | 67.84 | 0.18 | 162,737 | 13,751 | 862 | 9 | 6,824,525.97 | |
| East Hall | R7-3 | 29 | 6-4 | 32.27 | 68.31 | 0.05 | 40,621 | 6,402 | 271 | 2 | 53,030,448.16 | |
| Sonoraville | R6-4 | 28 | 6-4 | 33.08 | 71.23 | 0.04 | 38,052 | 2,475 | 174 | 1 | 71,134,419.42 | |
| Westside (Augusta) | R3-3 | 32 | 4-5-1 | 31.57 | 72.37 | 0.09 | 92,793 | 889 | 8 | 296,150,914.39 | ||
| Lumpkin County | R7-2 | 36 | 5-5 | 28.64 | 72.20 | 0.07 | 70,241 | 413 | 4 | 955,862,271.27 | ||
| Cedartown | R5-3 | 34 | 3-7 | 29.15 | 74.44 | 0.04 | 37,797 | 386 | 5 | 1,819,725,248.08 | ||
| Rockmart | R5-4 | 48 | 3-7 | 21.53 | 72.77 | 0.00 | 2,770 | 155 | 1 | 32,982,007,377.24 | ||
| Franklin County | R7-4 | 45 | 4-6 | 22.24 | 76.22 | 0.01 | 5,459 | 70 | 76,037,202,486.96 | |||
| Hephzibah | R3-4 | 53 | 6-4 | 16.78 | 74.56 | 0.00 | 2,431 | 46 | 591,332,204,453.15 |
Playoff Projections by Region
Each region is shown with the number of times of winning the state championship along with the associated odds.
| Region | Champion | Odds |
|---|---|---|
| 2-AAA | 382,251 | 1.62 |
| 3-AAA | 309,714 | 2.23 |
| 6-AAA | 163,705 | 5.11 |
| 4-AAA | 88,548 | 10.29 |
| 8-AAA | 44,890 | 21.28 |
| 5-AAA | 10,499 | 94.25 |
| 1-AAA | 299 | 3,346.44 |
| 7-AAA | 93 | 10,718.92 |
Region versus Region
| Matchup | Projection | 4-0 | 3-1 | 2-2 | 1-3 | 0-4 |
|---|---|---|---|---|---|---|
| 1-AAA versus 2-AAA | 1.48 - 2.52 | 0.1% | 4.5% | 44.9% | 44.1% | 6.4% |
| 3-AAA versus 4-AAA | 1.25 - 2.75 | 0.0% | 1.6% | 22.5% | 75.1% | 0.8% |
| 5-AAA versus 6-AAA | 1.38 - 2.62 | 0.0% | 1.5% | 37.2% | 58.6% | 2.7% |
| 7-AAA versus 8-AAA | 0.83 - 3.17 | 0.0% | 0.2% | 7.7% | 66.5% | 25.6% |
Modal Bracket
Although any specific bracket is highly unlikely, the modal bracket represents the most probable of all the possible brackets. The modal bracket assumes every favorite wins.

Class AA
Playoff Projections by Team
Each team is shown with its region, rating, the number of times making it to the quarterfinals, semifinals, and finals, and the number of times of winning the state championship along with the associated odds.
| Team | Region | Rank | Record | Rating | Draw | Depth | 2nd | Qtr | Semi | Finals | Champion | Odds |
|---|---|---|---|---|---|---|---|---|---|---|---|---|
| Vidalia | R2-1 | 1 | 10-0 | 74.38 | 49.43 | 3.20 | 966,333 | 950,050 | 579,870 | 392,787 | 314,881 | 2.18 |
| Fitzgerald | R1-1 | 3 | 9-1 | 68.65 | 46.55 | 3.41 | 984,947 | 947,519 | 881,524 | 351,278 | 244,924 | 3.08 |
| Greater Atlanta Christian | R6-1 | 2 | 10-0 | 71.09 | 49.41 | 2.76 | 994,785 | 919,234 | 409,786 | 248,408 | 185,115 | 4.40 |
| Brooks County | R1-2 | 5 | 7-3 | 62.44 | 49.32 | 3.05 | 921,362 | 819,996 | 761,896 | 427,895 | 118,397 | 7.45 |
| Benedictine | R2-2 | 4 | 8-2 | 64.08 | 57.12 | 1.90 | 634,136 | 571,469 | 379,030 | 239,075 | 74,075 | 12.50 |
| Lovett | R6-2 | 7 | 7-3 | 57.73 | 53.87 | 1.87 | 962,094 | 531,424 | 235,135 | 116,847 | 22,743 | 42.97 |
| Thomasville | R1-3 | 6 | 6-4 | 59.46 | 58.64 | 0.95 | 365,864 | 311,862 | 169,292 | 87,442 | 19,447 | 50.42 |
| Macon County | R4-1 | 8 | 8-2 | 56.29 | 50.82 | 1.66 | 904,651 | 455,797 | 192,861 | 93,449 | 17,402 | 56.47 |
| Darlington | R7-1 | 11 | 9-1 | 42.56 | 49.44 | 1.02 | 787,178 | 132,502 | 87,210 | 14,639 | 831 | 1,201.99 |
| Bowdon | R5-1 | 10 | 8-2 | 45.74 | 54.40 | 1.28 | 737,110 | 478,724 | 60,024 | 4,006 | 813 | 1,229.41 |
| Lamar County | R4-2 | 9 | 7-2-1 | 48.44 | 60.82 | 0.92 | 837,943 | 76,537 | 7,482 | 1,277 | 299 | 3,347.97 |
| Rabun County | R8-1 | 13 | 8-2 | 42.07 | 53.47 | 1.05 | 906,616 | 115,394 | 22,682 | 5,285 | 287 | 3,484.46 |
| Screven County | R3-1 | 18 | 9-1 | 38.33 | 50.89 | 1.11 | 656,334 | 391,248 | 59,571 | 7,034 | 270 | 3,705.67 |
| Wesleyan | R6-3 | 19 | 6-4 | 37.75 | 51.95 | 1.06 | 663,962 | 348,764 | 46,070 | 4,606 | 154 | 6,497.37 |
| Bleckley County | R4-3 | 14 | 5-5 | 41.74 | 57.25 | 0.82 | 551,319 | 249,176 | 21,865 | 933 | 123 | 8,159.88 |
| Bacon County | R2-3 | 17 | 6-4 | 38.71 | 54.64 | 0.14 | 78,638 | 35,742 | 19,610 | 2,131 | 78 | 12,830.48 |
| Jefferson County | R3-2 | 16 | 7-3 | 38.80 | 57.32 | 0.63 | 448,681 | 172,633 | 12,366 | 403 | 44 | 22,718.43 |
| Union County | R8-2 | 21 | 9-1 | 37.23 | 56.44 | 0.56 | 522,734 | 25,404 | 9,413 | 265 | 25 | 39,511.45 |
| Berrien | R1-4 | 15 | 4-6 | 41.69 | 62.83 | 0.06 | 33,667 | 22,271 | 1,554 | 165 | 21 | 46,806.68 |
| Model | R7-3 | 22 | 8-2 | 37.20 | 57.03 | 0.51 | 477,266 | 23,139 | 8,350 | 233 | 21 | 47,812.99 |
| Monticello | R4-4 | 29 | 4-6 | 32.74 | 54.53 | 0.50 | 343,666 | 144,355 | 12,875 | 811 | 17 | 59,555.41 |
| Pace Academy | R6-4 | 24 | 5-5 | 36.31 | 59.14 | 0.37 | 262,890 | 99,466 | 5,756 | 148 | 12 | 82,343.88 |
| Heard County | R5-2 | 31 | 5-5 | 30.06 | 52.84 | 0.46 | 336,038 | 115,633 | 8,766 | 462 | 7 | 134,690.86 |
| Coosa | R7-2 | 25 | 7-3 | 36.18 | 58.67 | 0.83 | 801,548 | 25,671 | 1,154 | 83 | 7 | 138,303.73 |
| Washington-Wilkes | R8-4 | 30 | 6-4 | 30.36 | 54.57 | 0.23 | 212,822 | 11,761 | 4,001 | 202 | 3 | 300,262.58 |
| Dublin | R3-4 | 26 | 6-4 | 34.67 | 60.70 | 0.11 | 95,349 | 10,128 | 858 | 112 | 3 | 358,531.89 |
| Swainsboro | R3-3 | 28 | 5-5 | 32.89 | 64.45 | 0.17 | 162,057 | 3,856 | 124 | 7 | 2,413,639.74 | |
| Bryan County | R2-4 | 32 | 5-5 | 27.72 | 59.19 | 0.02 | 15,053 | 3,938 | 702 | 8 | 3,333,057.68 | |
| Bremen | R5-3 | 33 | 6-4 | 26.27 | 60.81 | 0.04 | 37,906 | 2,650 | 111 | 8 | 11,714,098.24 | |
| Greene County | R8-3 | 36 | 5-5 | 23.10 | 61.81 | 0.20 | 198,452 | 2,007 | 27 | 1 | 64,011,282.41 | |
| Chattooga | R7-4 | 40 | 4-6 | 20.22 | 58.67 | 0.09 | 93,384 | 1,275 | 32 | 1 | 126,201,813.91 | |
| Chattahoochee County | R5-4 | 42 | 6-4 | 19.46 | 65.01 | 0.01 | 5,215 | 373 | 4 | 911,104,949.93 |
Playoff Projections by Region
Each region is shown with the number of times of winning the state championship along with the associated odds.
| Region | Champion | Odds |
|---|---|---|
| 2-AA | 389,035 | 1.57 |
| 1-AA | 382,789 | 1.61 |
| 6-AA | 208,025 | 3.81 |
| 4-AA | 17,840 | 55.06 |
| 7-AA | 859 | 1,162.58 |
| 5-AA | 820 | 1,218.14 |
| 3-AA | 317 | 3,153.55 |
| 8-AA | 316 | 3,167.96 |
Region versus Region
Each region is shown with the most likely region seeding orders and odds of each team making the playoffs.
| Matchup | Projection | 4-0 | 3-1 | 2-2 | 1-3 | 0-4 |
|---|---|---|---|---|---|---|
| 1-AA versus 2-AA | 2.31 - 1.69 | 1.1% | 34.1% | 59.0% | 5.6% | 0.1% |
| 3-AA versus 4-AA | 1.36 - 2.64 | 0.5% | 7.5% | 34.3% | 43.4% | 14.4% |
| 5-AA versus 6-AA | 1.12 - 2.88 | 0.0% | 1.1% | 26.2% | 56.0% | 16.7% |
| 7-AA versus 8-AA | 2.16 - 1.84 | 2.8% | 31.8% | 45.8% | 17.5% | 2.0% |
Modal Bracket
Although any specific bracket is highly unlikely, the modal bracket represents the most probable of all the possible brackets. The modal bracket assumes every favorite wins.