Maxwell playoff projections after Week 5
Below are the current Maxwell Ratings' playoff projections for each class.
The Maxwell Ratings playoff projections are based on a Monte Carlo simulation of the 2015 season. The simulation completed 1,000,000 seasons and teams with 100 or more championship wins in the simulation are shown.
While the Maxwell Ratings reflect each team’s strength, the simulation highlights the impact of the season’s structure as defined by the games, region alignments, and playoff brackets.
All out of state opponents were considered equal to the average of the GHSA team’s classification (i.e., out of state opponents of Class AAAAAA GHSA teams were treated as an average Class AAAAAA team).
Although regions may use different criteria, in the simulation all standings were determined by using recursive head-to-head records with all ties being broken randomly.
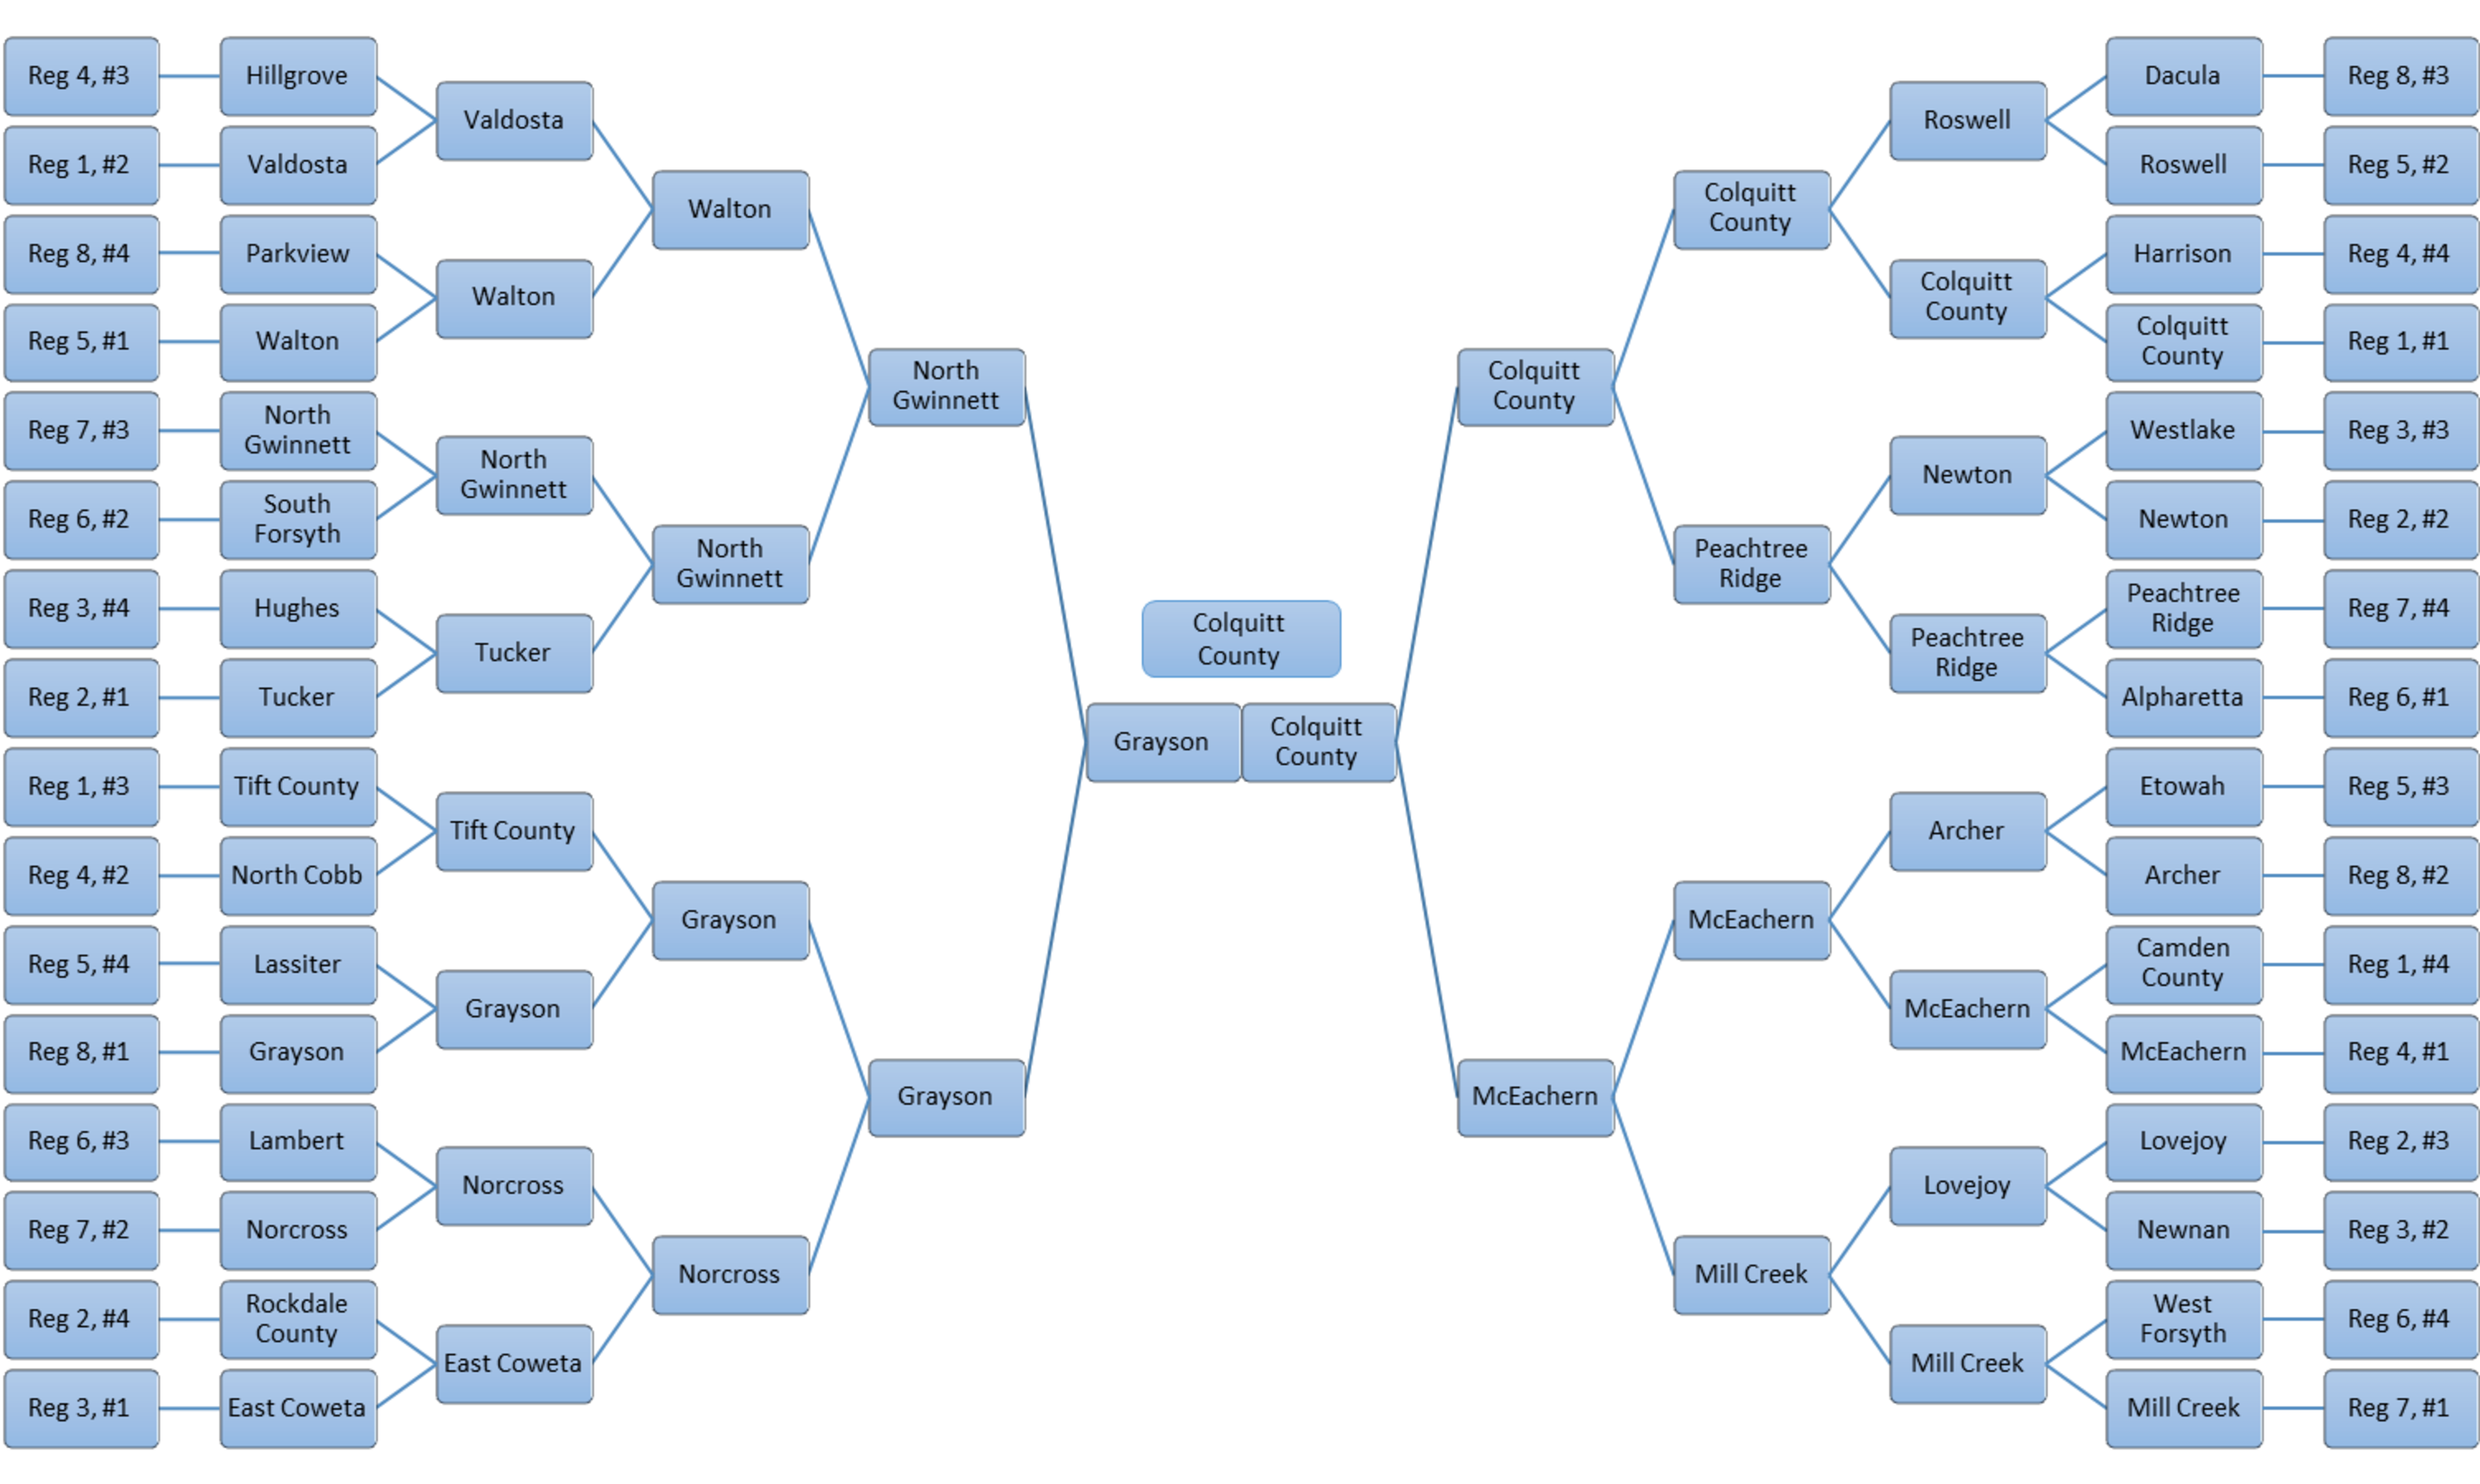
Class AAAAAA
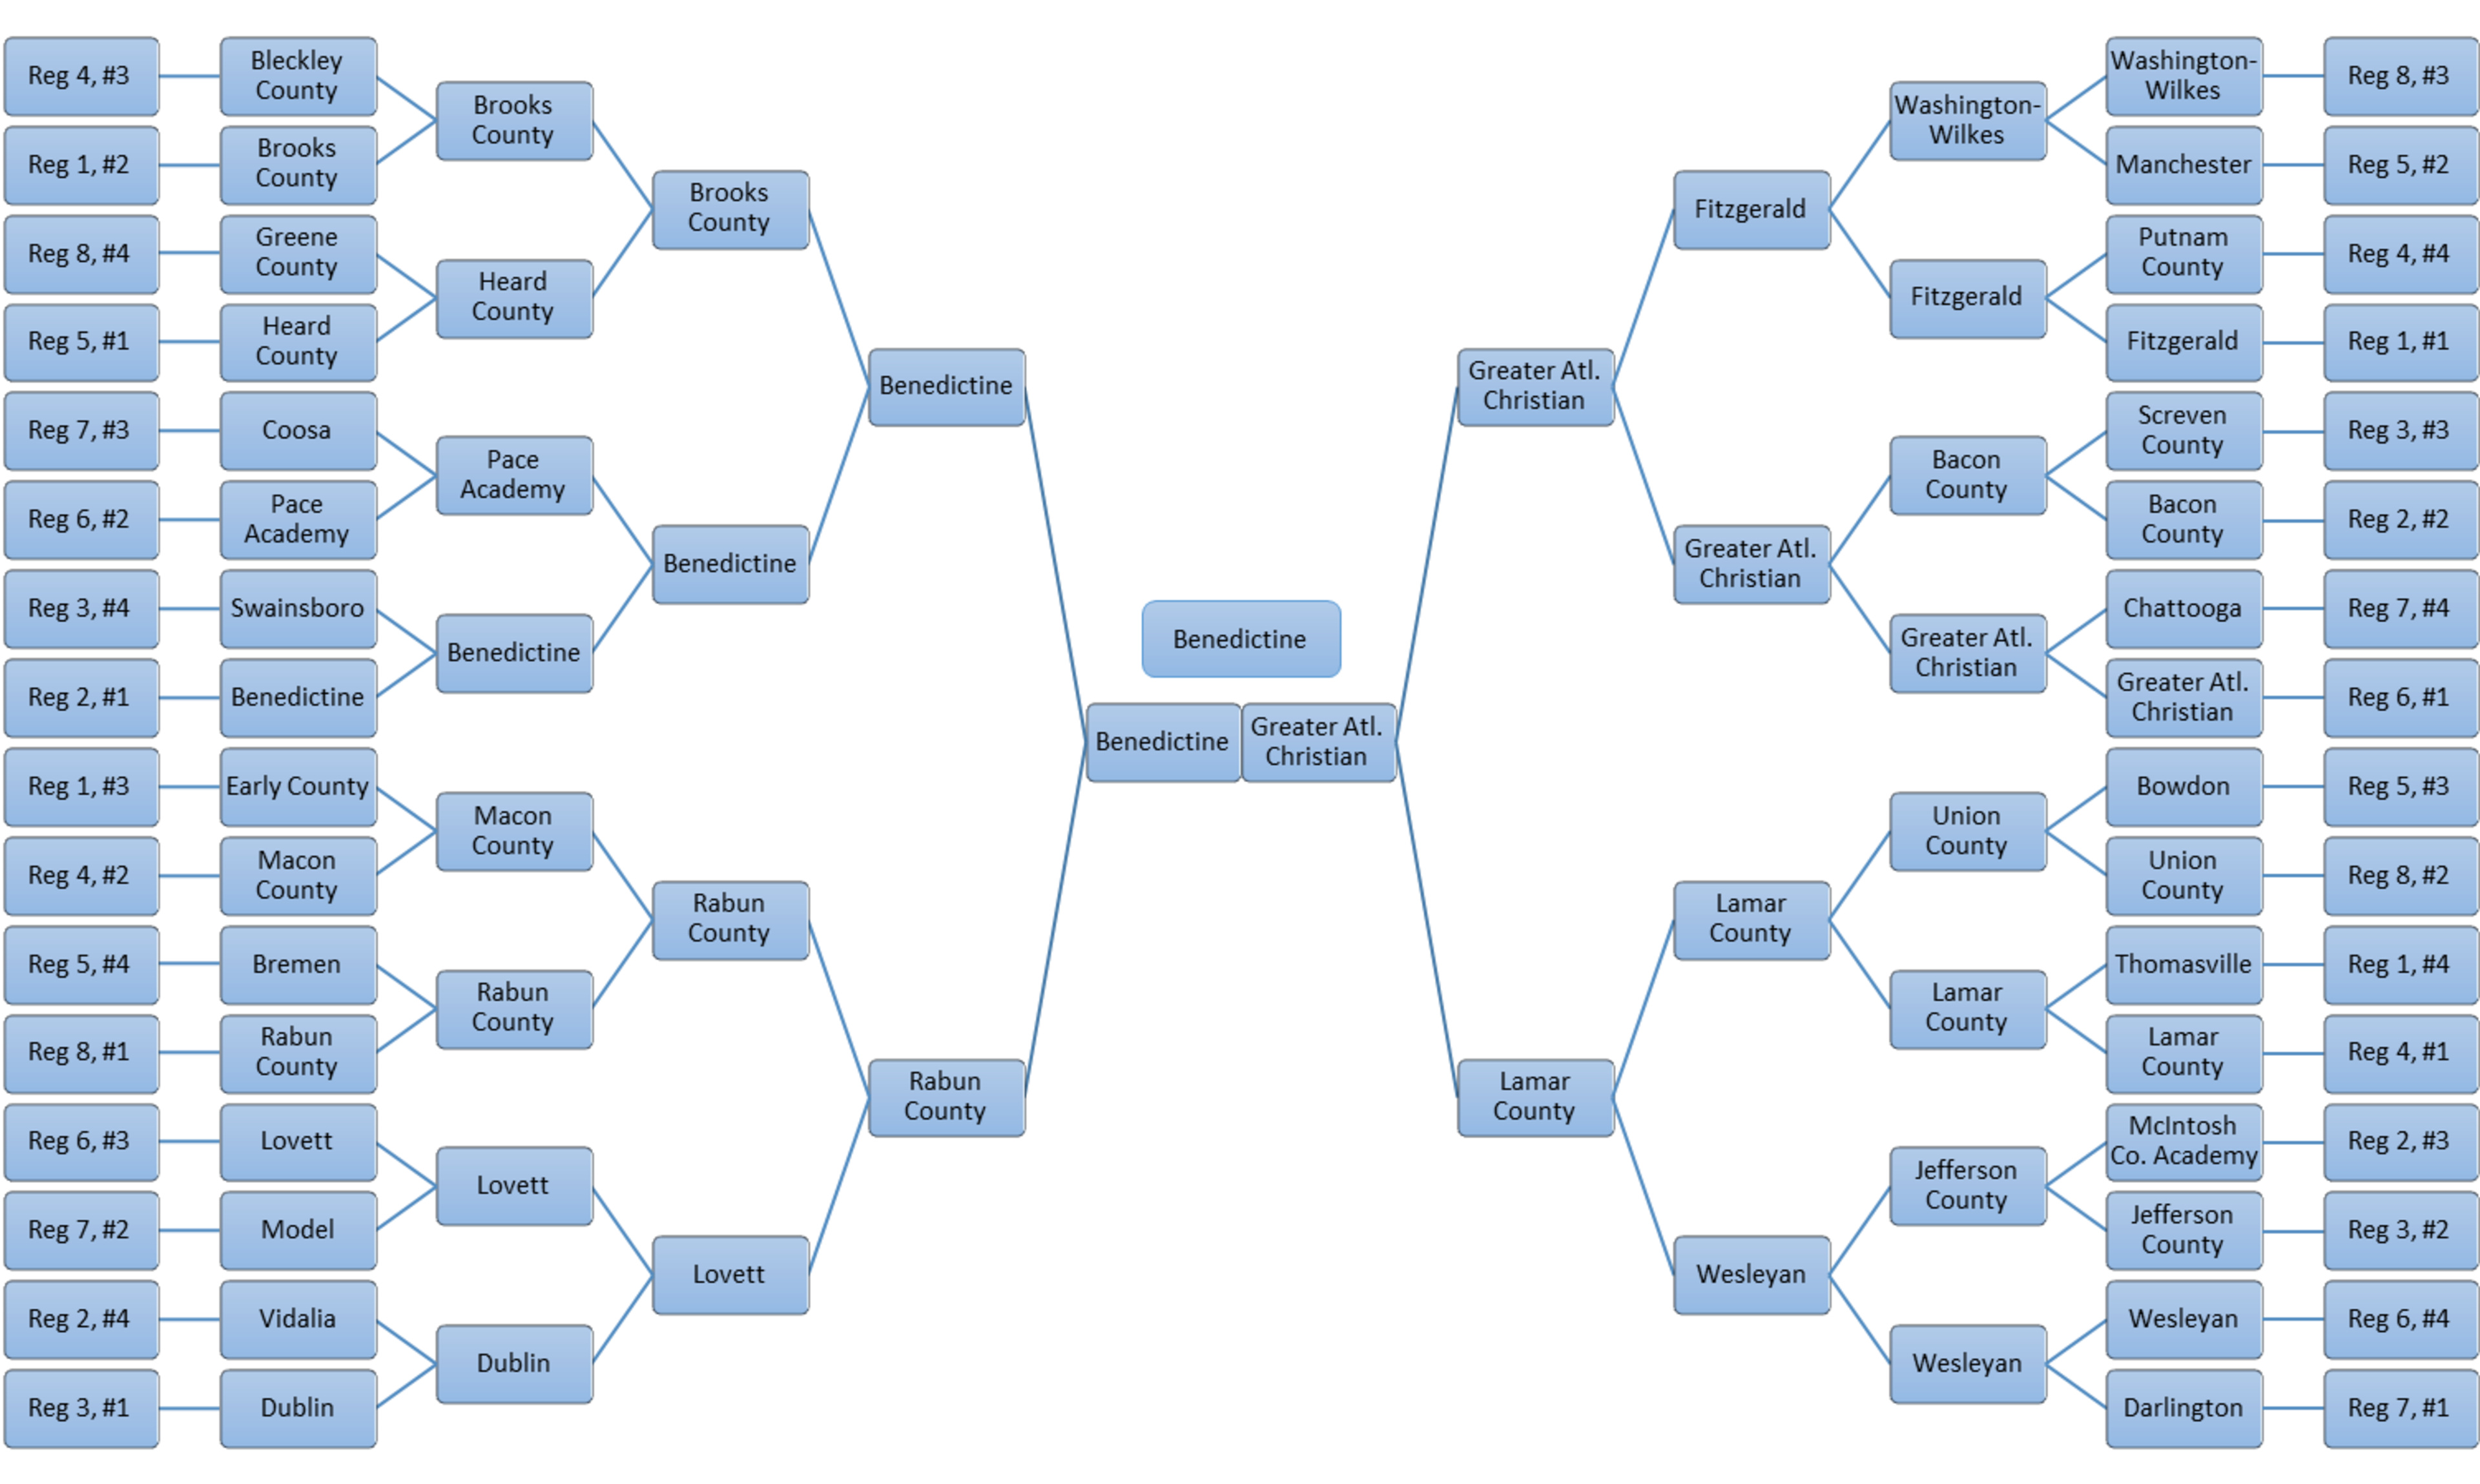
Modal Bracket
Although any specific bracket is highly unlikely, the modal bracket represents the most probable of all the possible brackets.
Playoff Projections by Team
Each team is shown with its region, rating, the number of times making it to the finals, and the number of times of winning the state championship along with the associated odds.
| Team | Region | Rating | Finals | Champion | Odds |
|---|---|---|---|---|---|
| Colquitt County | 1-AAAAAA | 100.55 | 630,271 | 495,688 | 1.02 |
| Grayson | 8-AAAAAA | 93.01 | 420,148 | 194,668 | 4.14 |
| Mill Creek | 7-AAAAAA | 88.13 | 201,542 | 83,051 | 11.04 |
| McEachern | 4-AAAAAA | 89.16 | 133,850 | 63,397 | 14.77 |
| Archer | 8-AAAAAA | 88.32 | 113,894 | 49,998 | 19.00 |
| Peachtree Ridge | 7-AAAAAA | 83.06 | 107,214 | 29,823 | 32.53 |
| Norcross | 7-AAAAAA | 82.11 | 97,242 | 24,776 | 39.36 |
| Walton | 5-AAAAAA | 82.49 | 77,763 | 19,673 | 49.83 |
| Roswell | 5-AAAAAA | 80.94 | 45,210 | 10,762 | 91.92 |
| Tucker | 2-AAAAAA | 78.45 | 46,577 | 9,047 | 109.53 |
| Dacula | 8-AAAAAA | 78.62 | 20,812 | 4,414 | 225.55 |
| Lowndes | 1-AAAAAA | 76.77 | 15,907 | 2,499 | 399.16 |
| Camden County | 1-AAAAAA | 76.81 | 14,141 | 2,295 | 434.73 |
| Valdosta | 1-AAAAAA | 76.78 | 13,315 | 2,180 | 457.72 |
| North Gwinnett | 7-AAAAAA | 75.53 | 11,734 | 1,990 | 501.51 |
| Tift County | 1-AAAAAA | 75.53 | 10,663 | 1,582 | 631.11 |
| East Coweta | 3-AAAAAA | 70.67 | 7,434 | 775 | 1,289.32 |
| Collins Hill | 7-AAAAAA | 69.66 | 5,867 | 628 | 1,591.36 |
| Etowah | 5-AAAAAA | 73.63 | 3,946 | 623 | 1,604.14 |
| North Cobb | 4-AAAAAA | 71.72 | 4,796 | 525 | 1,903.76 |
| Lee County | 1-AAAAAA | 73.08 | 3,657 | 441 | 2,266.57 |
| Parkview | 8-AAAAAA | 71.20 | 2,258 | 244 | 4,097.36 |
| Newton | 2-AAAAAA | 67.13 | 2,751 | 238 | 4,200.68 |
| Central Gwinnett | 8-AAAAAA | 69.27 | 1,392 | 140 | 7,141.86 |
| Newnan | 3-AAAAAA | 65.16 | 1,433 | 104 | 9,614.38 |
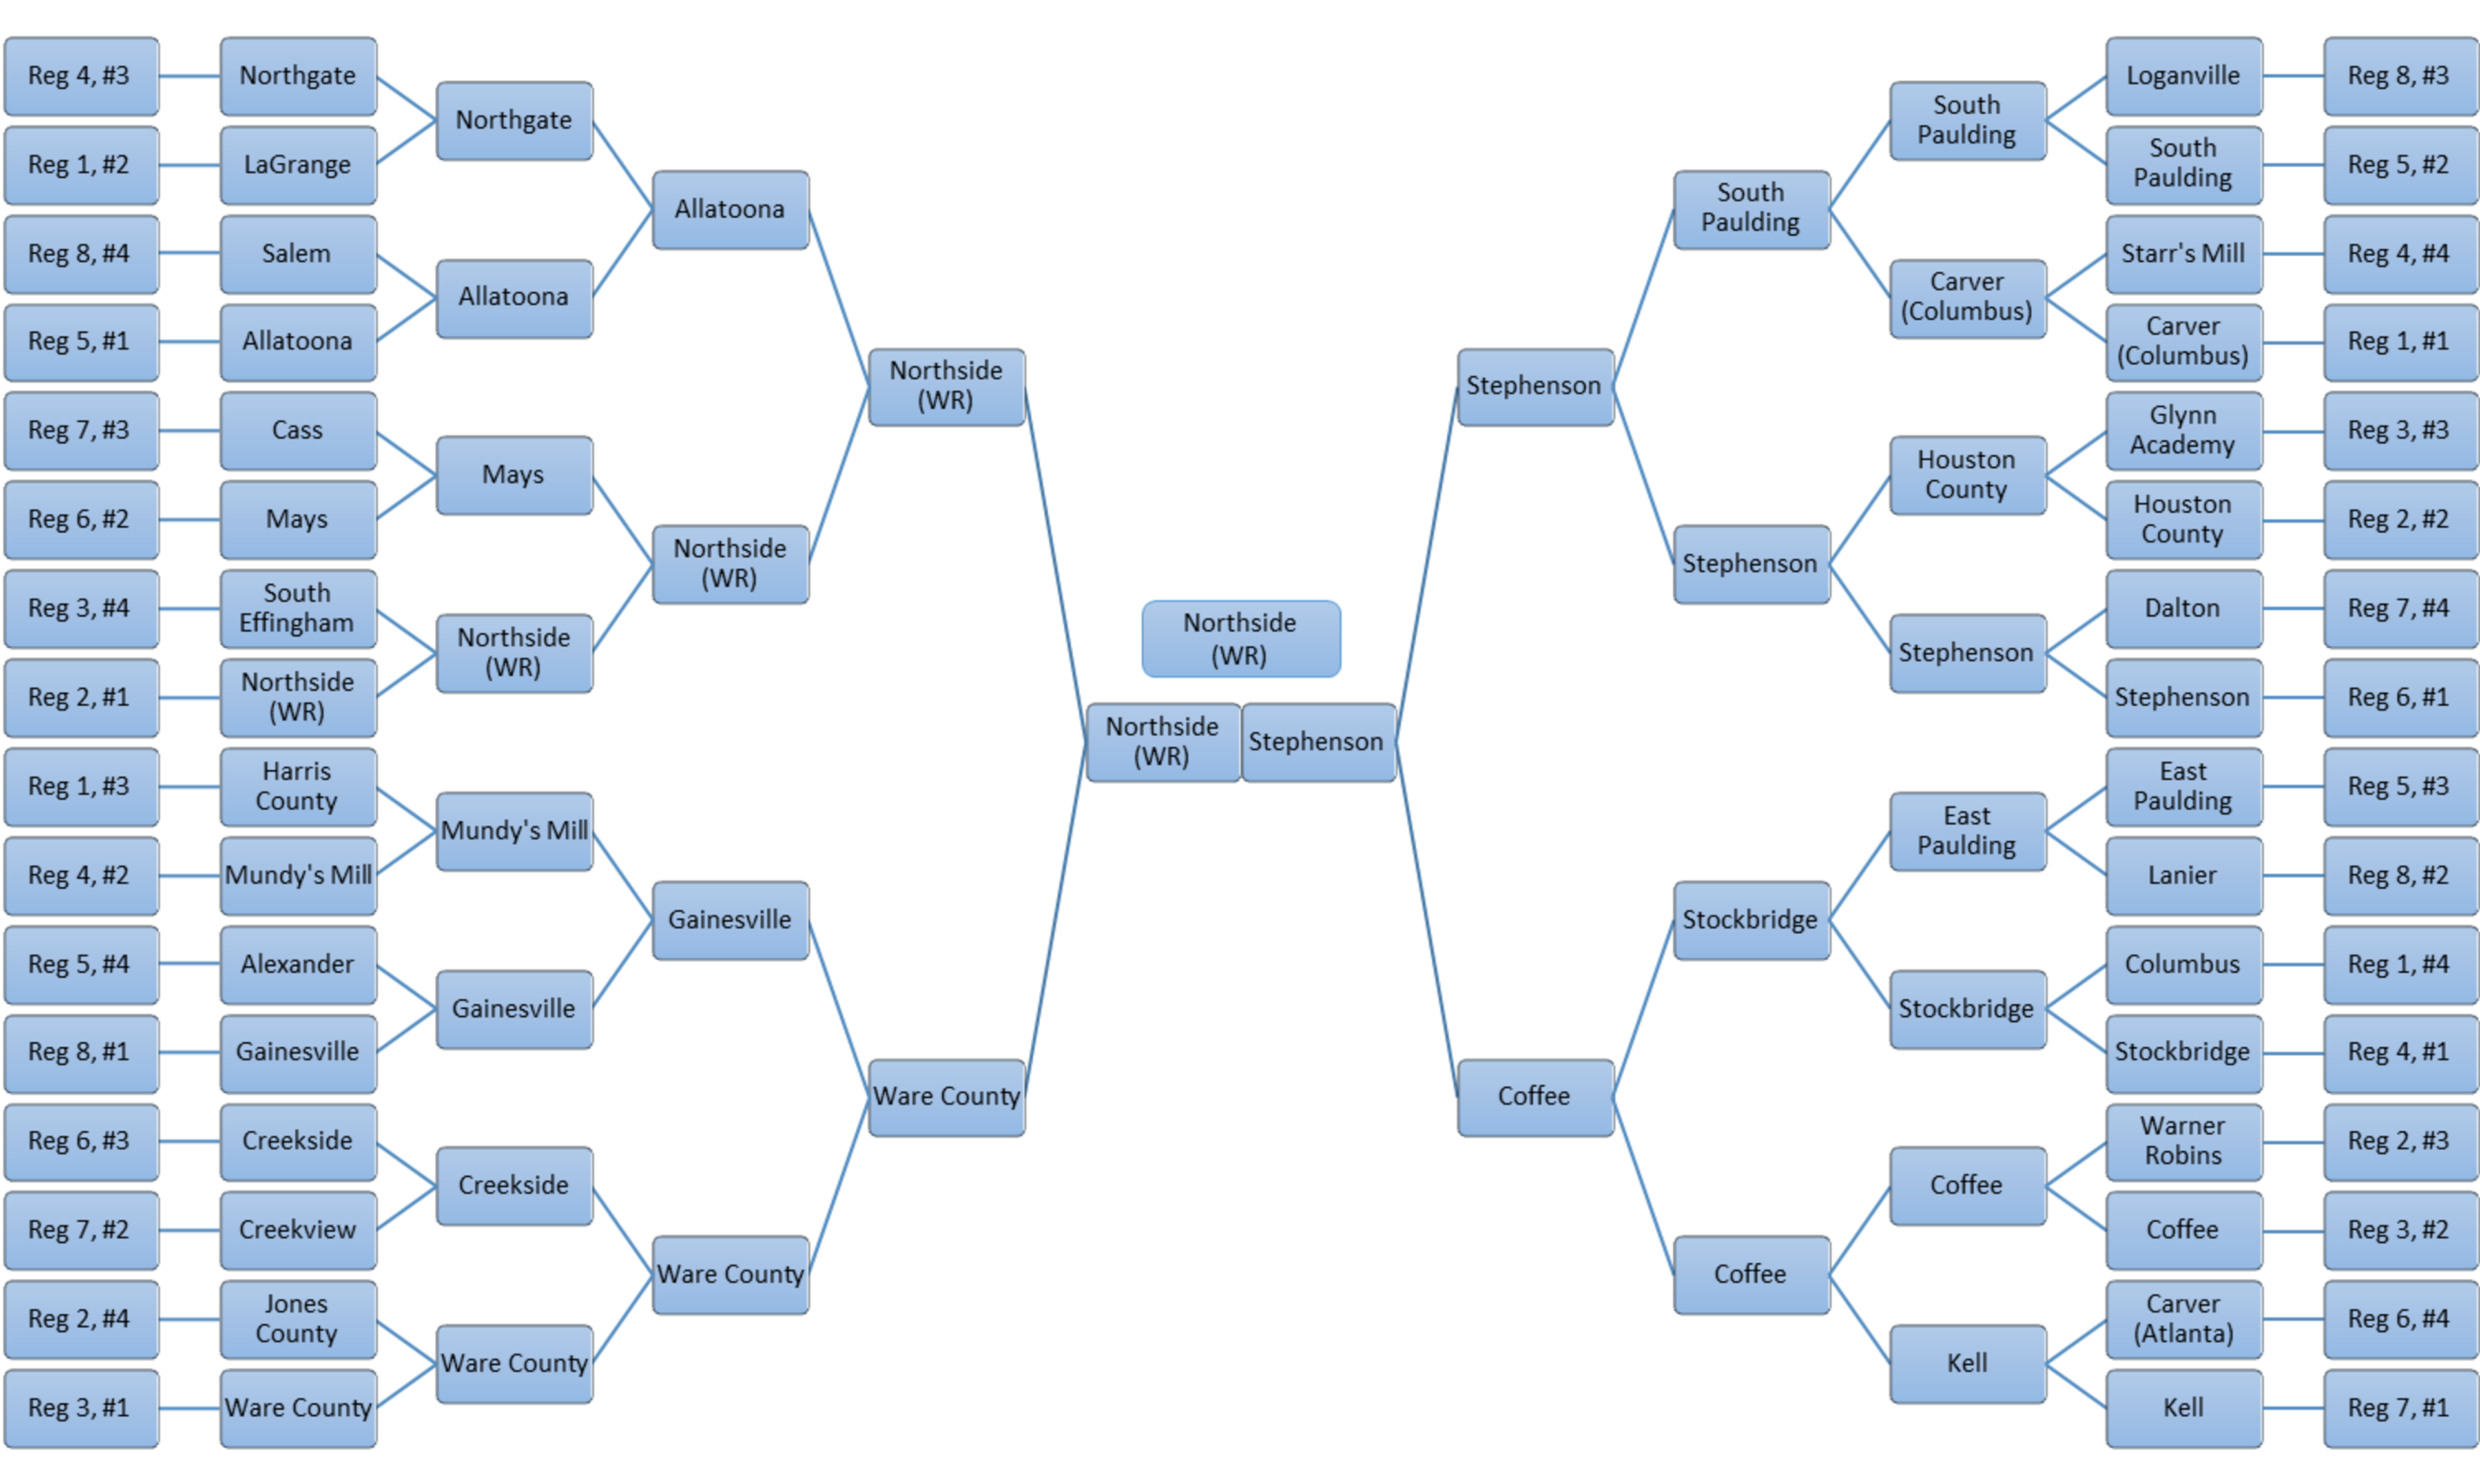
Class AAAAA
Modal Bracket
Although any specific bracket is highly unlikely, the modal bracket represents the most probable of all the possible brackets.
Playoff Projections by Team
Each team is shown with its region, rating, the number of times making it to the finals, and the number of times of winning the state championship along with the associated odds.
| Team | Region | Rating | Finals | Champion | Odds |
|---|---|---|---|---|---|
| Northside (Warner Robins) | 2-AAAAA | 79.83 | 311,907 | 205,510 | 3.87 |
| Ware County | 3-AAAAA | 79.19 | 316,600 | 202,782 | 3.93 |
| Stephenson | 6-Div A-AAAAA | 77.99 | 290,904 | 166,357 | 5.01 |
| Coffee | 3-AAAAA | 73.80 | 169,603 | 74,939 | 12.34 |
| Mays | 6-Div B-AAAAA | 74.07 | 140,451 | 66,077 | 14.13 |
| Allatoona | 5-AAAAA | 72.97 | 134,410 | 61,224 | 15.33 |
| Stockbridge | 4-Div B-AAAAA | 72.09 | 141,000 | 58,051 | 16.23 |
| Creekside | 6-Div B-AAAAA | 72.89 | 102,760 | 45,684 | 20.89 |
| Houston County | 2-AAAAA | 69.96 | 75,354 | 26,336 | 36.97 |
| Gainesville | 8-AAAAA | 69.81 | 66,686 | 25,563 | 38.12 |
| South Paulding | 5-AAAAA | 69.04 | 70,538 | 24,678 | 39.52 |
| East Paulding | 5-AAAAA | 66.61 | 38,092 | 11,571 | 85.42 |
| Kell | 7-Div B-AAAAA | 66.26 | 29,642 | 8,454 | 117.29 |
| Mundy's Mill | 4-Div A-AAAAA | 62.99 | 15,538 | 3,723 | 267.60 |
| Lanier | 8-AAAAA | 62.87 | 15,583 | 3,510 | 283.90 |
| Carver (Columbus) | 1-AAAAA | 61.74 | 14,778 | 3,037 | 328.27 |
| Glynn Academy | 3-AAAAA | 63.39 | 10,807 | 2,442 | 408.50 |
| Northgate | 4-Div A-AAAAA | 61.62 | 11,119 | 2,442 | 408.50 |
| Alexander | 5-AAAAA | 61.97 | 10,765 | 2,199 | 453.75 |
| Warner Robins | 2-AAAAA | 61.64 | 5,782 | 1,184 | 843.59 |
| Jones County | 2-AAAAA | 60.33 | 4,235 | 795 | 1,256.86 |
| Carver (Atlanta) | 6-Div B-AAAAA | 60.05 | 3,479 | 627 | 1,593.90 |
| New Manchester | 5-AAAAA | 58.27 | 2,660 | 439 | 2,276.90 |
| Starr's Mill | 4-Div A-AAAAA | 57.67 | 2,728 | 426 | 2,346.42 |
| Creekview | 7-Div A-AAAAA | 58.07 | 2,338 | 369 | 2,709.03 |
| Drew | 4-Div A-AAAAA | 57.05 | 1,974 | 317 | 3,153.57 |
| Cass | 7-Div A-AAAAA | 57.26 | 1,849 | 290 | 3,447.28 |
| Loganville | 8-AAAAA | 55.93 | 2,233 | 271 | 3,689.04 |
| South Effingham | 3-AAAAA | 55.60 | 1,089 | 150 | 6,665.67 |
| LaGrange | 1-AAAAA | 53.51 | 1,208 | 135 | 7,406.41 |
Class AAAA
Modal Bracket
Although any specific bracket is highly unlikely, the modal bracket represents the most probable of all the possible brackets.

Playoff Projections by Team
Each team is shown with its region, rating, the number of times making it to the finals, and the number of times of winning the state championship along with the associated odds.
| Team | Region | Rating | Finals | Champion | Odds |
|---|---|---|---|---|---|
| Buford | 8-AAAA | 86.34 | 705,791 | 546,373 | 0.83 |
| Cartersville | 7-AAAA | 77.57 | 468,690 | 188,432 | 4.31 |
| Sandy Creek | 5-AAAA | 74.77 | 216,102 | 89,067 | 10.23 |
| Woodward Academy | 5-AAAA | 73.57 | 193,148 | 72,969 | 12.70 |
| Marist | 6-AAAA | 72.16 | 178,701 | 58,758 | 16.02 |
| St. Pius X | 6-AAAA | 67.01 | 79,834 | 19,951 | 49.12 |
| Bainbridge | 1-Div B-AAAA | 65.07 | 36,837 | 7,545 | 131.54 |
| Mary Persons | 2-AAAA | 62.99 | 20,541 | 4,136 | 240.78 |
| Thomson | 3-AAAA | 61.47 | 21,034 | 3,837 | 259.62 |
| Jonesboro | 4-Div B-AAAA | 60.91 | 14,693 | 2,180 | 457.72 |
| Carrollton | 5-AAAA | 58.15 | 11,153 | 1,255 | 795.81 |
| Burke County | 3-AAAA | 58.04 | 9,544 | 1,251 | 798.36 |
| North Oconee | 8-AAAA | 56.97 | 7,958 | 785 | 1,272.89 |
| West Laurens | 2-AAAA | 57.63 | 6,072 | 738 | 1,354.01 |
| Spalding | 4-Div B-AAAA | 57.21 | 6,149 | 680 | 1,469.59 |
| Wayne County | 3-AAAA | 55.06 | 4,170 | 415 | 2,408.64 |
| Cairo | 1-Div A-AAAA | 55.67 | 3,135 | 344 | 2,905.98 |
| Thomas County Central | 1-Div A-AAAA | 55.41 | 2,998 | 311 | 3,214.43 |
| Eagle's Landing | 4-Div A-AAAA | 55.34 | 2,812 | 269 | 3,716.47 |
| Baldwin | 2-AAAA | 52.69 | 1,481 | 137 | 7,298.27 |
| Stephens County | 8-AAAA | 52.47 | 1,755 | 119 | 8,402.36 |
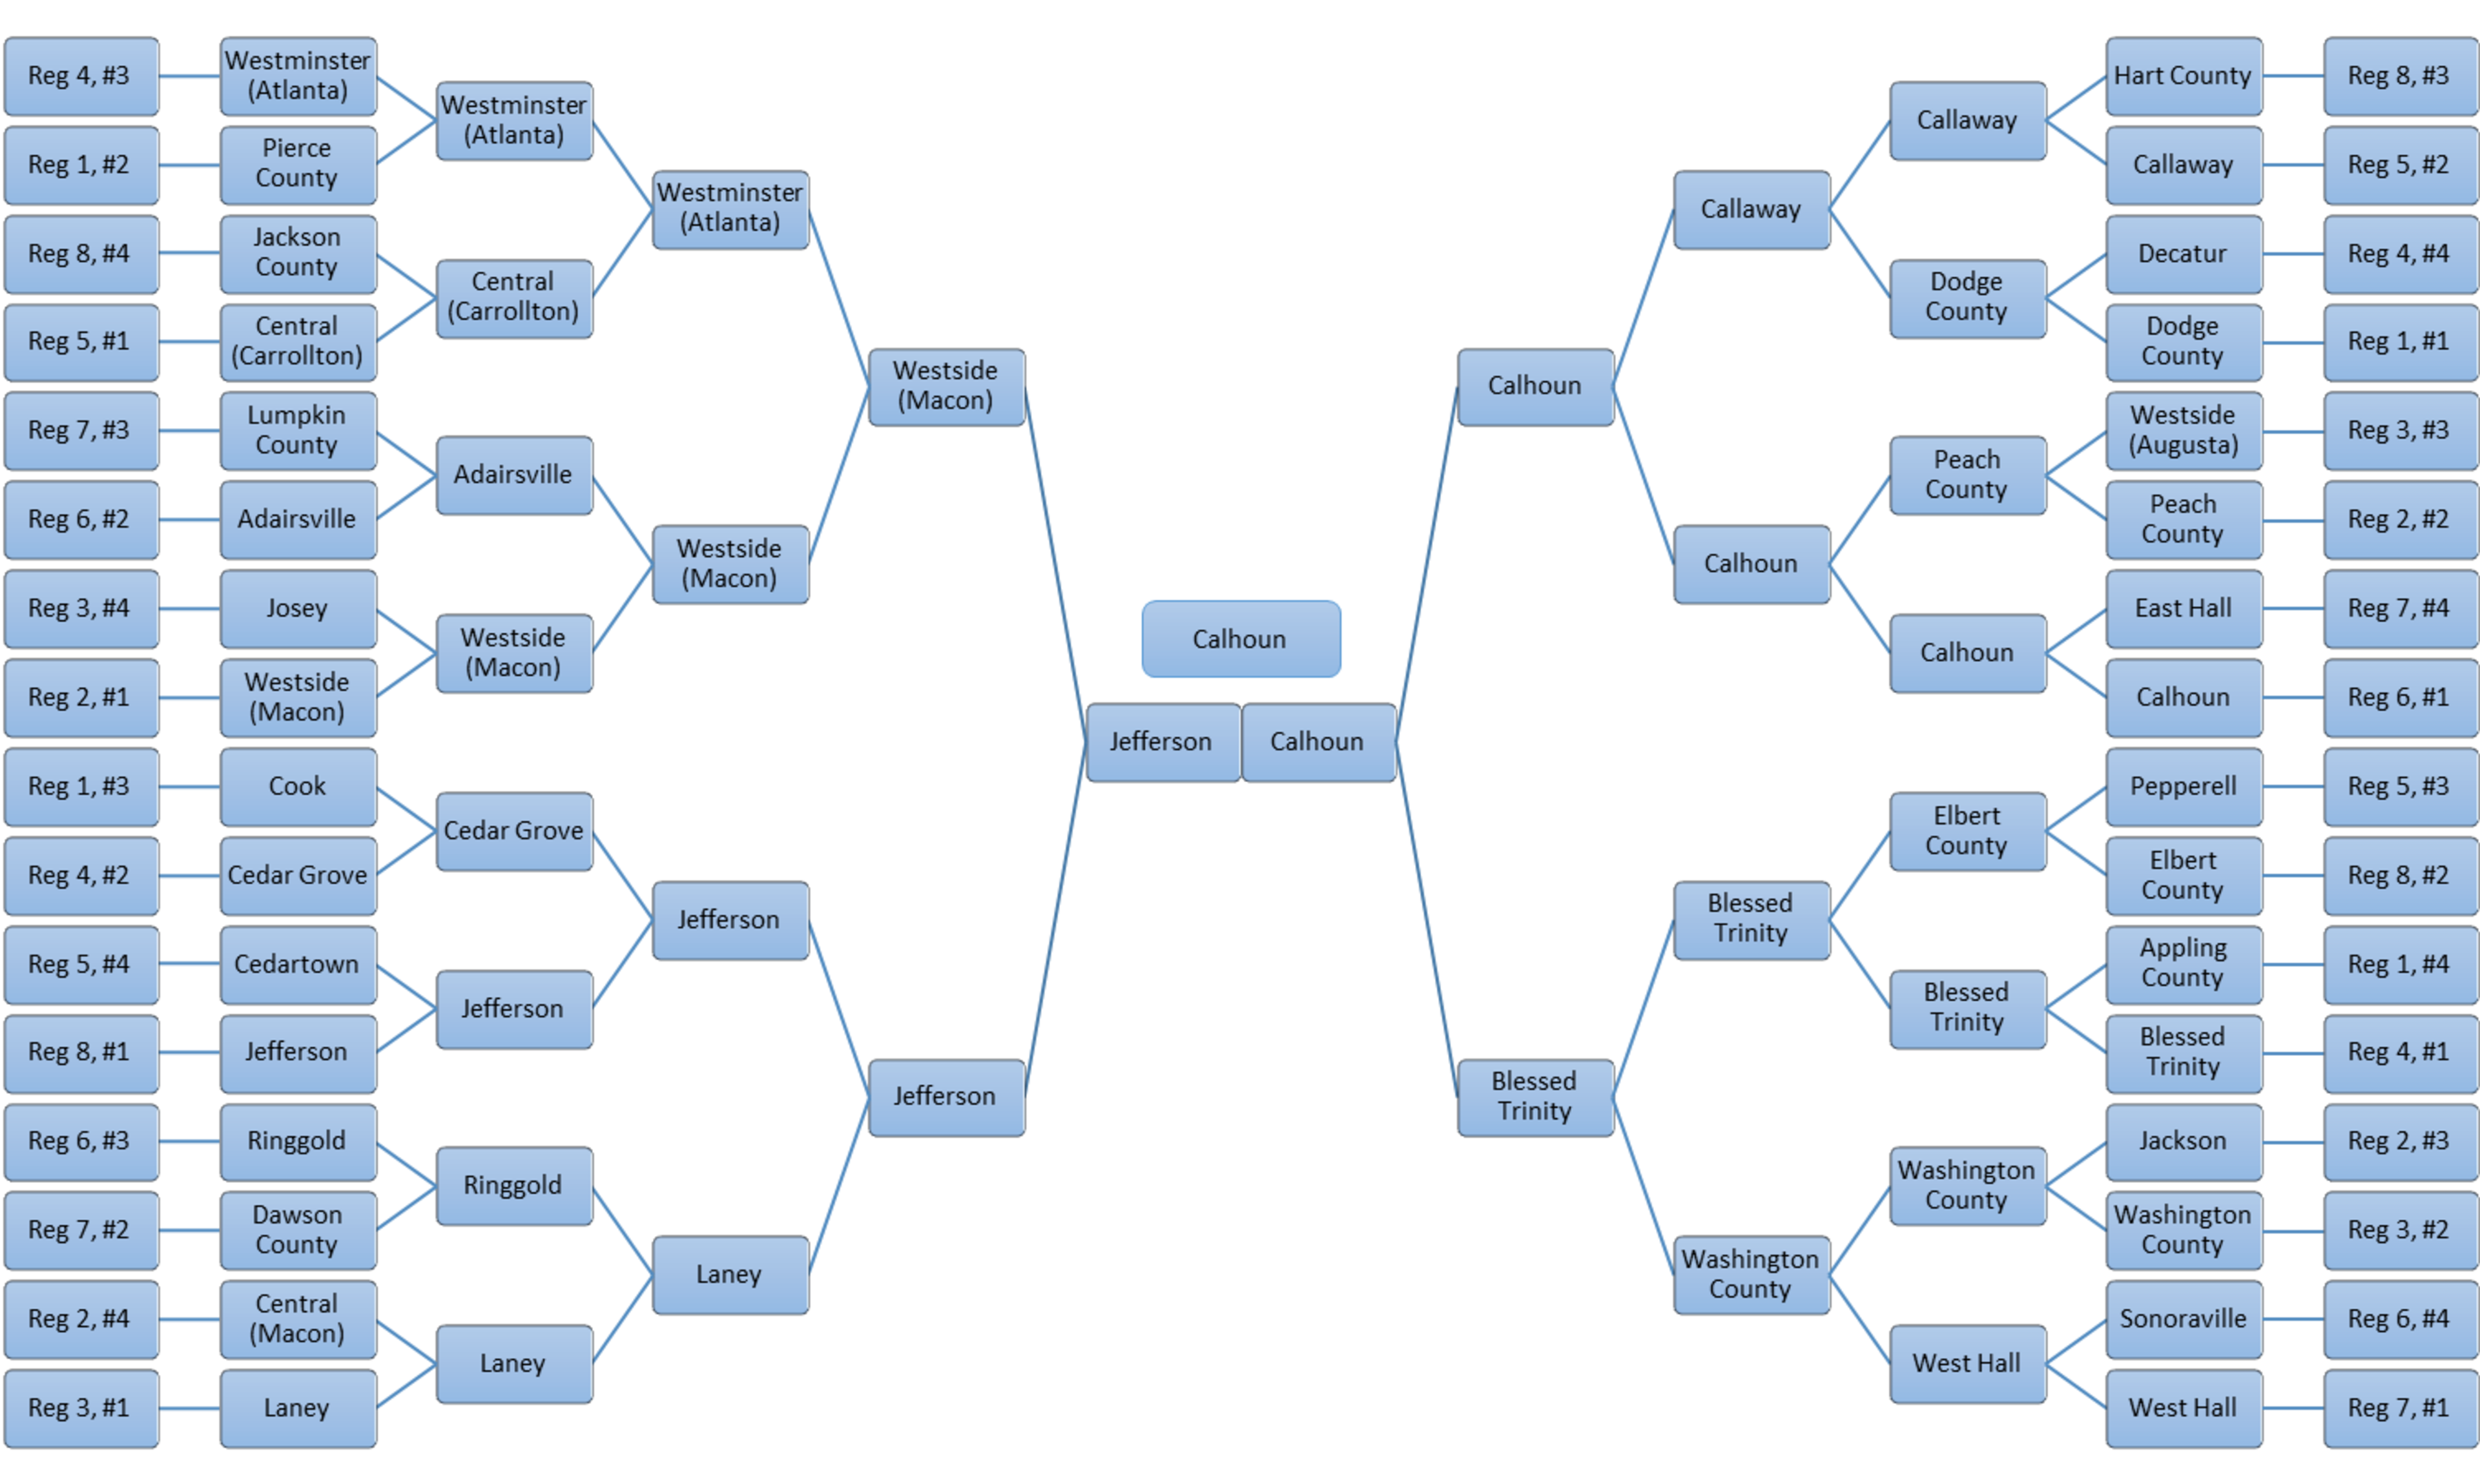
Class AAA
Modal Bracket
Although any specific bracket is highly unlikely, the modal bracket represents the most probable of all the possible brackets.
Playoff Projections by Team
Each team is shown with its region, rating, the number of times making it to the finals, and the number of times of winning the state championship along with the associated odds.
| Team | Region | Rating | Finals | Champion | Odds |
|---|---|---|---|---|---|
| Calhoun | 6-AAA | 77.36 | 567,503 | 424,953 | 1.35 |
| Blessed Trinity | 4-Div B-AAA | 75.94 | 451,131 | 310,402 | 2.22 |
| Jefferson | 8-AAA | 68.72 | 283,877 | 112,780 | 7.87 |
| Cedar Grove | 4-Div A-AAA | 64.43 | 196,767 | 54,199 | 17.45 |
| Elbert County | 8-AAA | 63.45 | 136,959 | 40,149 | 23.91 |
| Westside (Macon) | 2-AAA | 60.41 | 131,358 | 27,877 | 34.87 |
| Peach County | 2-AAA | 54.77 | 39,853 | 6,254 | 158.90 |
| Westminster (Atlanta) | 4-Div B-AAA | 54.99 | 35,060 | 4,895 | 203.29 |
| Laney | 3-AAA | 52.21 | 33,167 | 3,989 | 249.69 |
| Central (Carrollton) | 5-AAA | 54.00 | 27,932 | 3,915 | 254.43 |
| Adairsville | 6-AAA | 51.33 | 28,489 | 2,769 | 360.14 |
| Callaway | 5-AAA | 52.87 | 20,024 | 2,693 | 370.33 |
| Hart County | 8-AAA | 51.87 | 10,723 | 1,538 | 649.20 |
| Pierce County | 1-Div A-AAA | 50.95 | 7,521 | 980 | 1,019.41 |
| Dodge County | 1-Div A-AAA | 50.97 | 7,415 | 917 | 1,089.51 |
| Washington County | 3-AAA | 47.27 | 9,905 | 887 | 1,126.40 |
| Jackson | 2-AAA | 44.81 | 3,689 | 276 | 3,622.19 |
| Cook | 1-Div A-AAA | 46.39 | 1,578 | 136 | 7,351.94 |
Class AA
Modal Bracket
Although any specific bracket is highly unlikely, the modal bracket represents the most probable of all the possible brackets.
Playoff Projections by Team
Each team is shown with its region, rating, the number of times making it to the finals, and the number of times of winning the state championship along with the associated odds.
| Team | Region | Rating | Finals | Champion | Odds |
|---|---|---|---|---|---|
| Benedictine | 2-AA | 76.55 | 739,513 | 490,744 | 1.04 |
| Greater Atlanta Christian | 6-AA | 74.24 | 609,574 | 336,532 | 1.97 |
| Fitzgerald | 1-AA | 67.16 | 323,984 | 125,028 | 7.00 |
| Rabun County | 8-AA | 52.38 | 49,019 | 8,732 | 113.52 |
| Pace Academy | 6-AA | 53.42 | 45,956 | 7,632 | 130.03 |
| Lovett | 6-AA | 52.95 | 43,031 | 7,258 | 136.78 |
| Brooks County | 1-AA | 52.37 | 43,034 | 7,146 | 138.94 |
| Dublin | 3-AA | 51.52 | 33,948 | 5,424 | 183.37 |
| Lamar County | 4-AA | 48.75 | 24,753 | 3,117 | 319.82 |
| Macon County | 4-AA | 48.14 | 19,330 | 2,310 | 431.90 |
| Wesleyan | 6-AA | 46.87 | 11,883 | 1,306 | 764.70 |
| Darlington | 7-AA | 45.48 | 9,670 | 917 | 1,089.51 |
| Early County | 1-AA | 45.49 | 9,061 | 912 | 1,095.49 |
| Thomasville | 1-AA | 44.90 | 7,731 | 733 | 1,363.26 |
| Jefferson County | 3-AA | 44.35 | 7,203 | 687 | 1,454.60 |
| Bacon County | 2-AA | 42.98 | 4,076 | 350 | 2,856.14 |
| Heard County | 5-AA | 42.02 | 4,434 | 330 | 3,029.30 |
| Vidalia | 2-AA | 43.43 | 4,159 | 329 | 3,038.51 |
| Model | 7-AA | 40.68 | 2,016 | 163 | 6,133.97 |
| Screven County | 3-AA | 40.25 | 1,851 | 107 | 9,344.79 |
Class A-Public
Modal Bracket
Although any specific bracket is highly unlikely, the modal bracket represents the most probable of all the possible brackets.

Playoff Projections by Team
Each team is shown with its region, rating, the number of times making it to the finals, and the number of times of winning the state championship along with the associated odds.
| Team | Region | Rating | Finals | Champion | Odds |
|---|---|---|---|---|---|
| Irwin County | 2-A | 50.69 | 337,025 | 232,960 | 3.29 |
| Marion County | 4-A | 47.16 | 317,641 | 196,789 | 4.08 |
| Clinch County | 2-A | 46.93 | 249,005 | 141,123 | 6.09 |
| Lincoln County | 7-Div B-A | 44.54 | 219,880 | 108,209 | 8.24 |
| Charlton County | 2-A | 51.41 | 134,127 | 89,221 | 10.21 |
| Emanuel County Institute | 3-Div B-A | 41.53 | 203,149 | 84,973 | 10.77 |
| Turner County | 2-A | 40.19 | 119,959 | 45,094 | 21.18 |
| Commerce | 8-A | 35.88 | 93,739 | 27,712 | 35.09 |
| Greenville | 4-A | 34.56 | 76,620 | 21,302 | 45.94 |
| Wilkinson County | 7-Div A-A | 34.27 | 65,734 | 17,021 | 57.75 |
| Dooly County | 4-A | 34.24 | 48,972 | 12,985 | 76.01 |
| Mount Zion (Carroll) | 6-Div A-A | 30.43 | 30,086 | 5,930 | 167.63 |
| Hawkinsville | 4-A | 31.93 | 25,323 | 5,709 | 174.16 |
| Trion | 6-Div A-A | 29.96 | 25,352 | 4,812 | 206.81 |
| Miller County | 1-A | 22.24 | 15,093 | 1,491 | 669.69 |
| Hancock Central | 7-Div B-A | 26.62 | 8,703 | 1,277 | 782.09 |
| Telfair County | 2-A | 24.67 | 9,571 | 1,189 | 840.04 |
| Johnson County | 3-Div B-A | 28.02 | 4,141 | 683 | 1,463.13 |
| Claxton | 3-Div A-A | 25.99 | 4,397 | 610 | 1,638.34 |
| Terrell County | 1-A | 19.48 | 4,558 | 397 | 2,517.89 |
| Mitchell County | 1-A | 18.90 | 5,156 | 389 | 2,569.69 |
Class A-Private
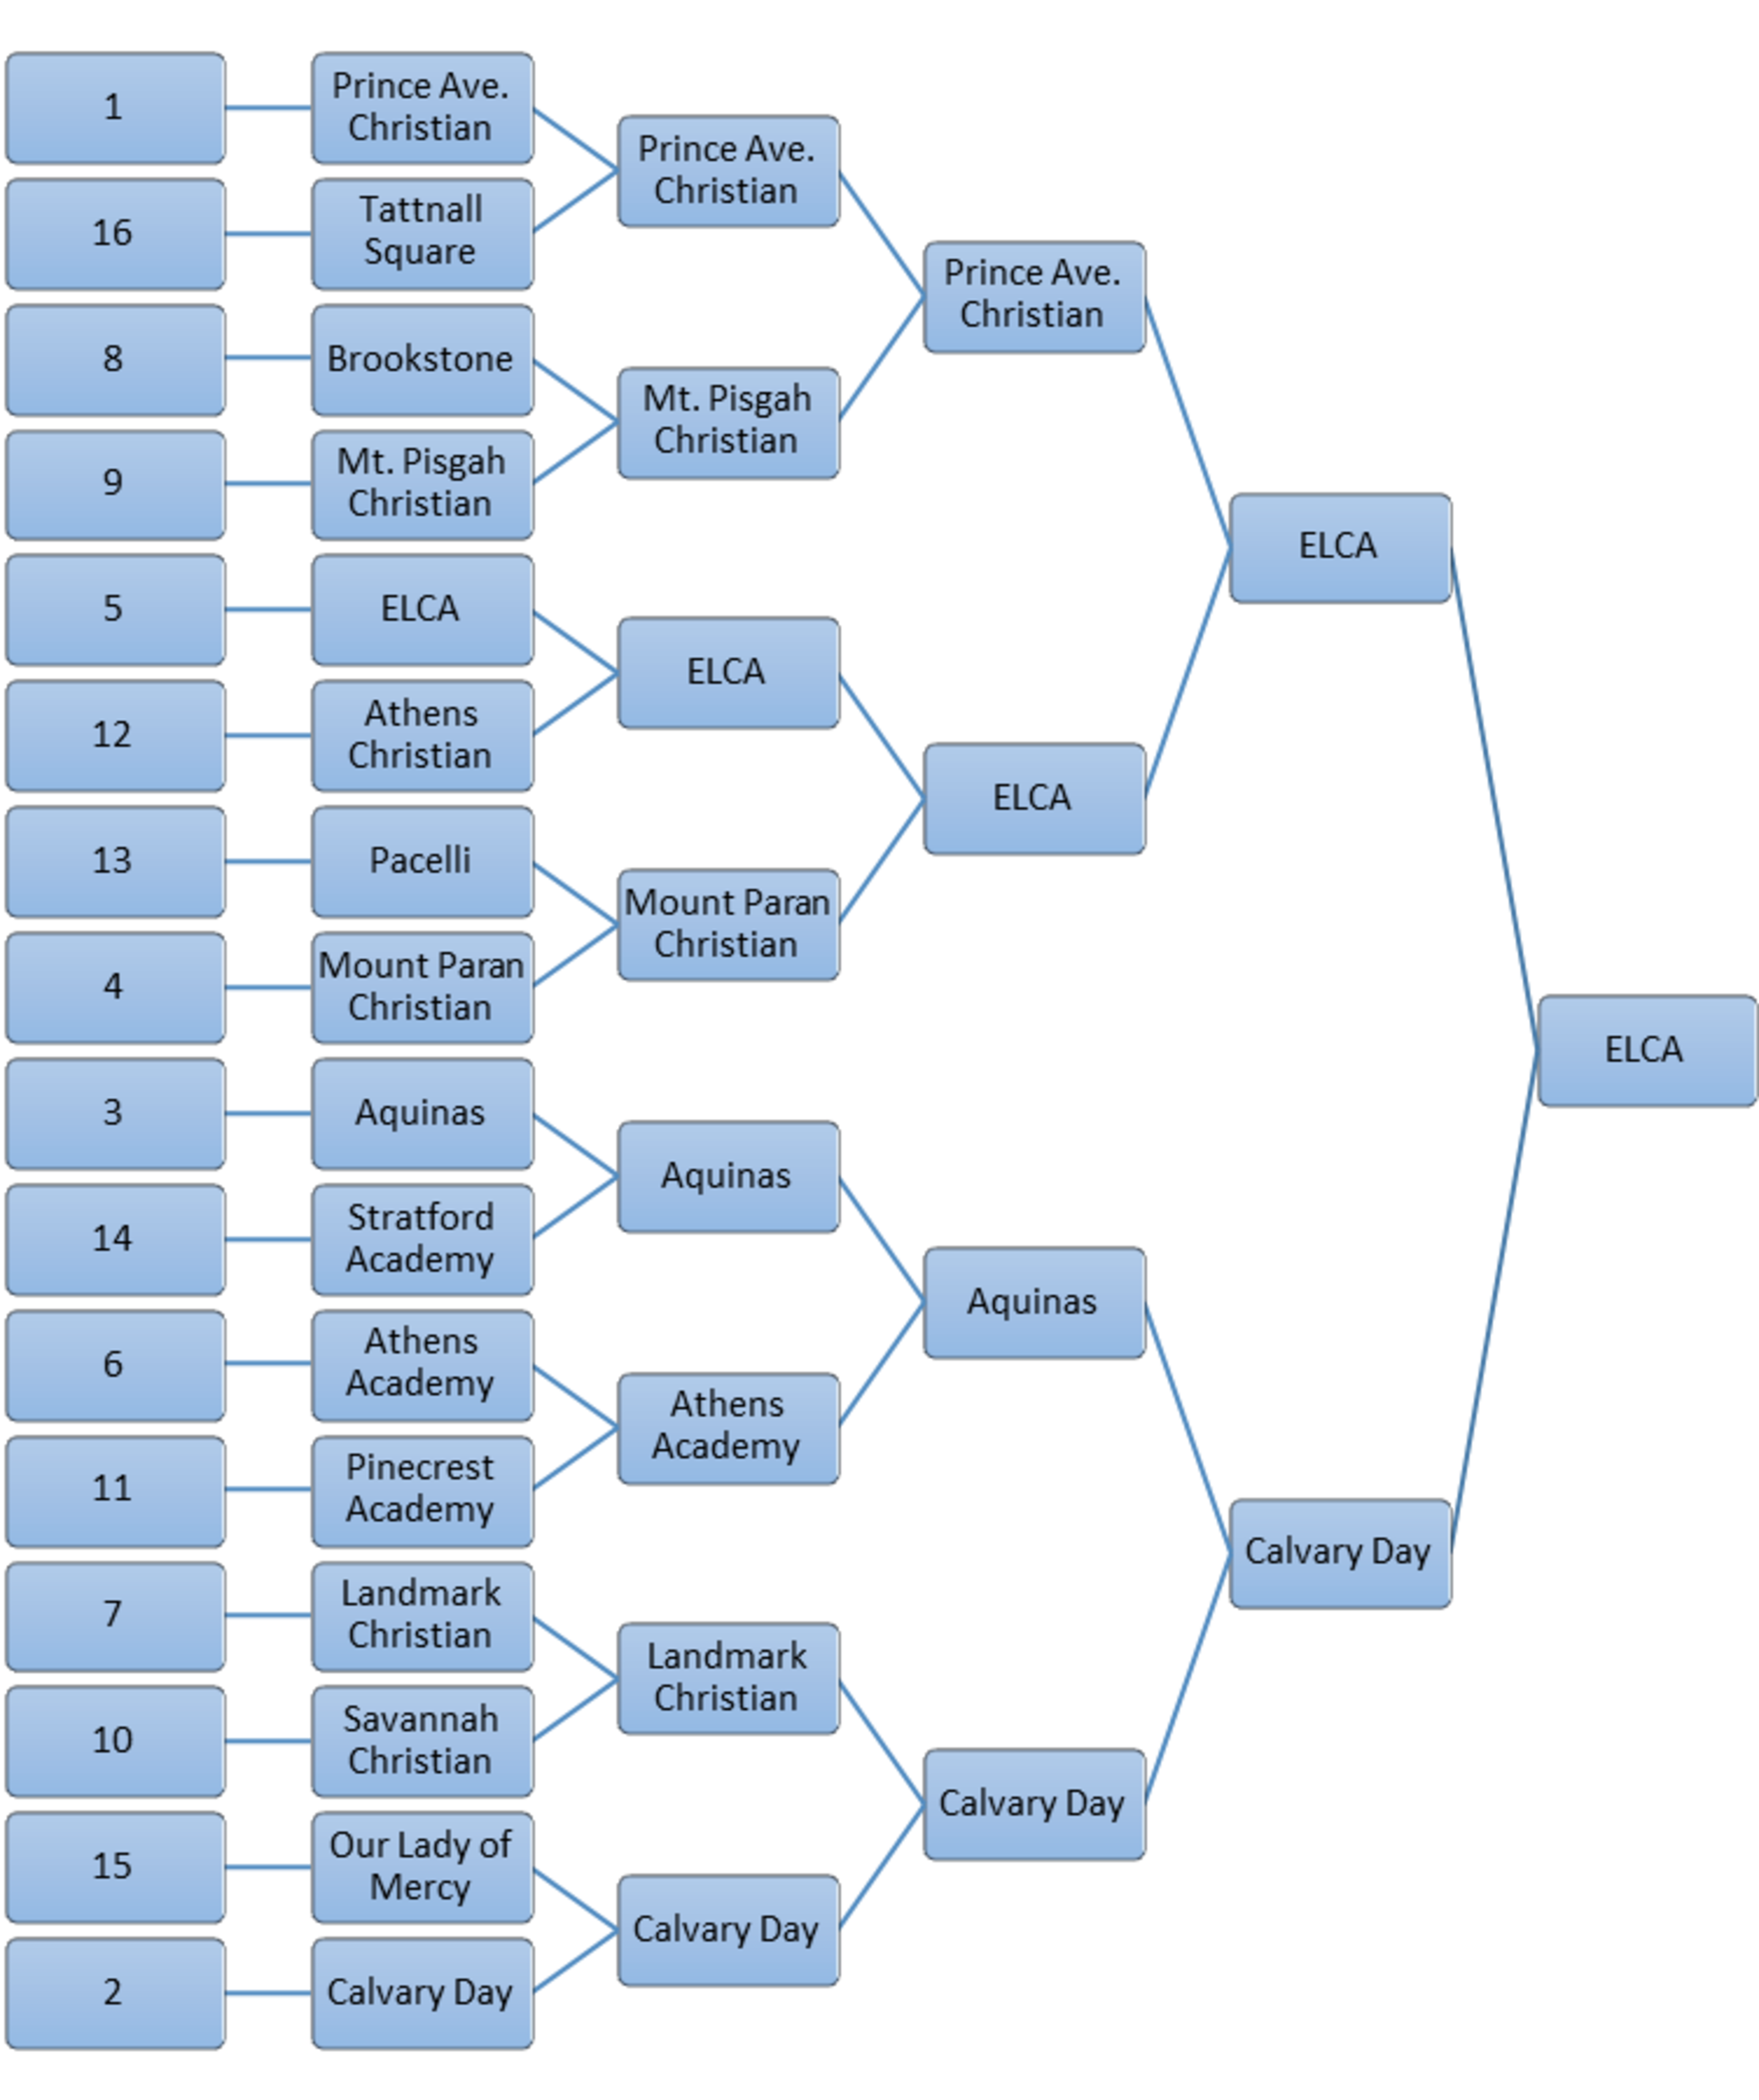
Modal Bracket
Although any specific bracket is highly unlikely, the modal bracket represents the most probable of all the possible brackets.
Playoff Projections by Team
Each team is shown with its region, rating, the number of times making it to the finals, and the number of times of winning the state championship along with the associated odds.
| Team | Region | Rating | Finals | Champion | Odds |
|---|---|---|---|---|---|
| Eagle's Landing Christian | 5-A | 62.39 | 632,604 | 495,177 | 1.02 |
| Mount Paran Christian | 6-Div A-A | 54.83 | 365,651 | 182,191 | 4.49 |
| Prince Avenue Christian | 8-A | 51.80 | 304,183 | 132,975 | 6.52 |
| Calvary Day | 3-Div A-A | 49.59 | 256,064 | 89,551 | 10.17 |
| Aquinas | 7-Div B-A | 45.89 | 138,588 | 37,891 | 25.39 |
| Landmark Christian | 5-A | 44.32 | 102,332 | 26,092 | 37.33 |
| Savannah Christian | 3-Div A-A | 43.24 | 75,937 | 17,742 | 55.36 |
| Mount Pisgah Christian | 6-Div B-A | 40.14 | 33,785 | 6,429 | 154.55 |
| Athens Academy | 8-A | 36.96 | 32,511 | 4,750 | 209.53 |
| Pinecrest Academy | 6-Div B-A | 37.07 | 21,958 | 3,323 | 299.93 |
| Brookstone | 4-A | 33.80 | 10,228 | 1,102 | 906.44 |
| First Presbyterian | 7-Div A-A | 34.19 | 7,852 | 910 | 1,097.90 |
| Stratford Academy | 7-Div A-A | 34.21 | 7,041 | 864 | 1,156.41 |
| Pacelli | 4-A | 32.40 | 7,513 | 770 | 1,297.70 |