Atlanta Braves
5 stats that define Braves’ NLDS Game 3 loss
A statistical breakdown of key numbers from Tuesday’s matchup.
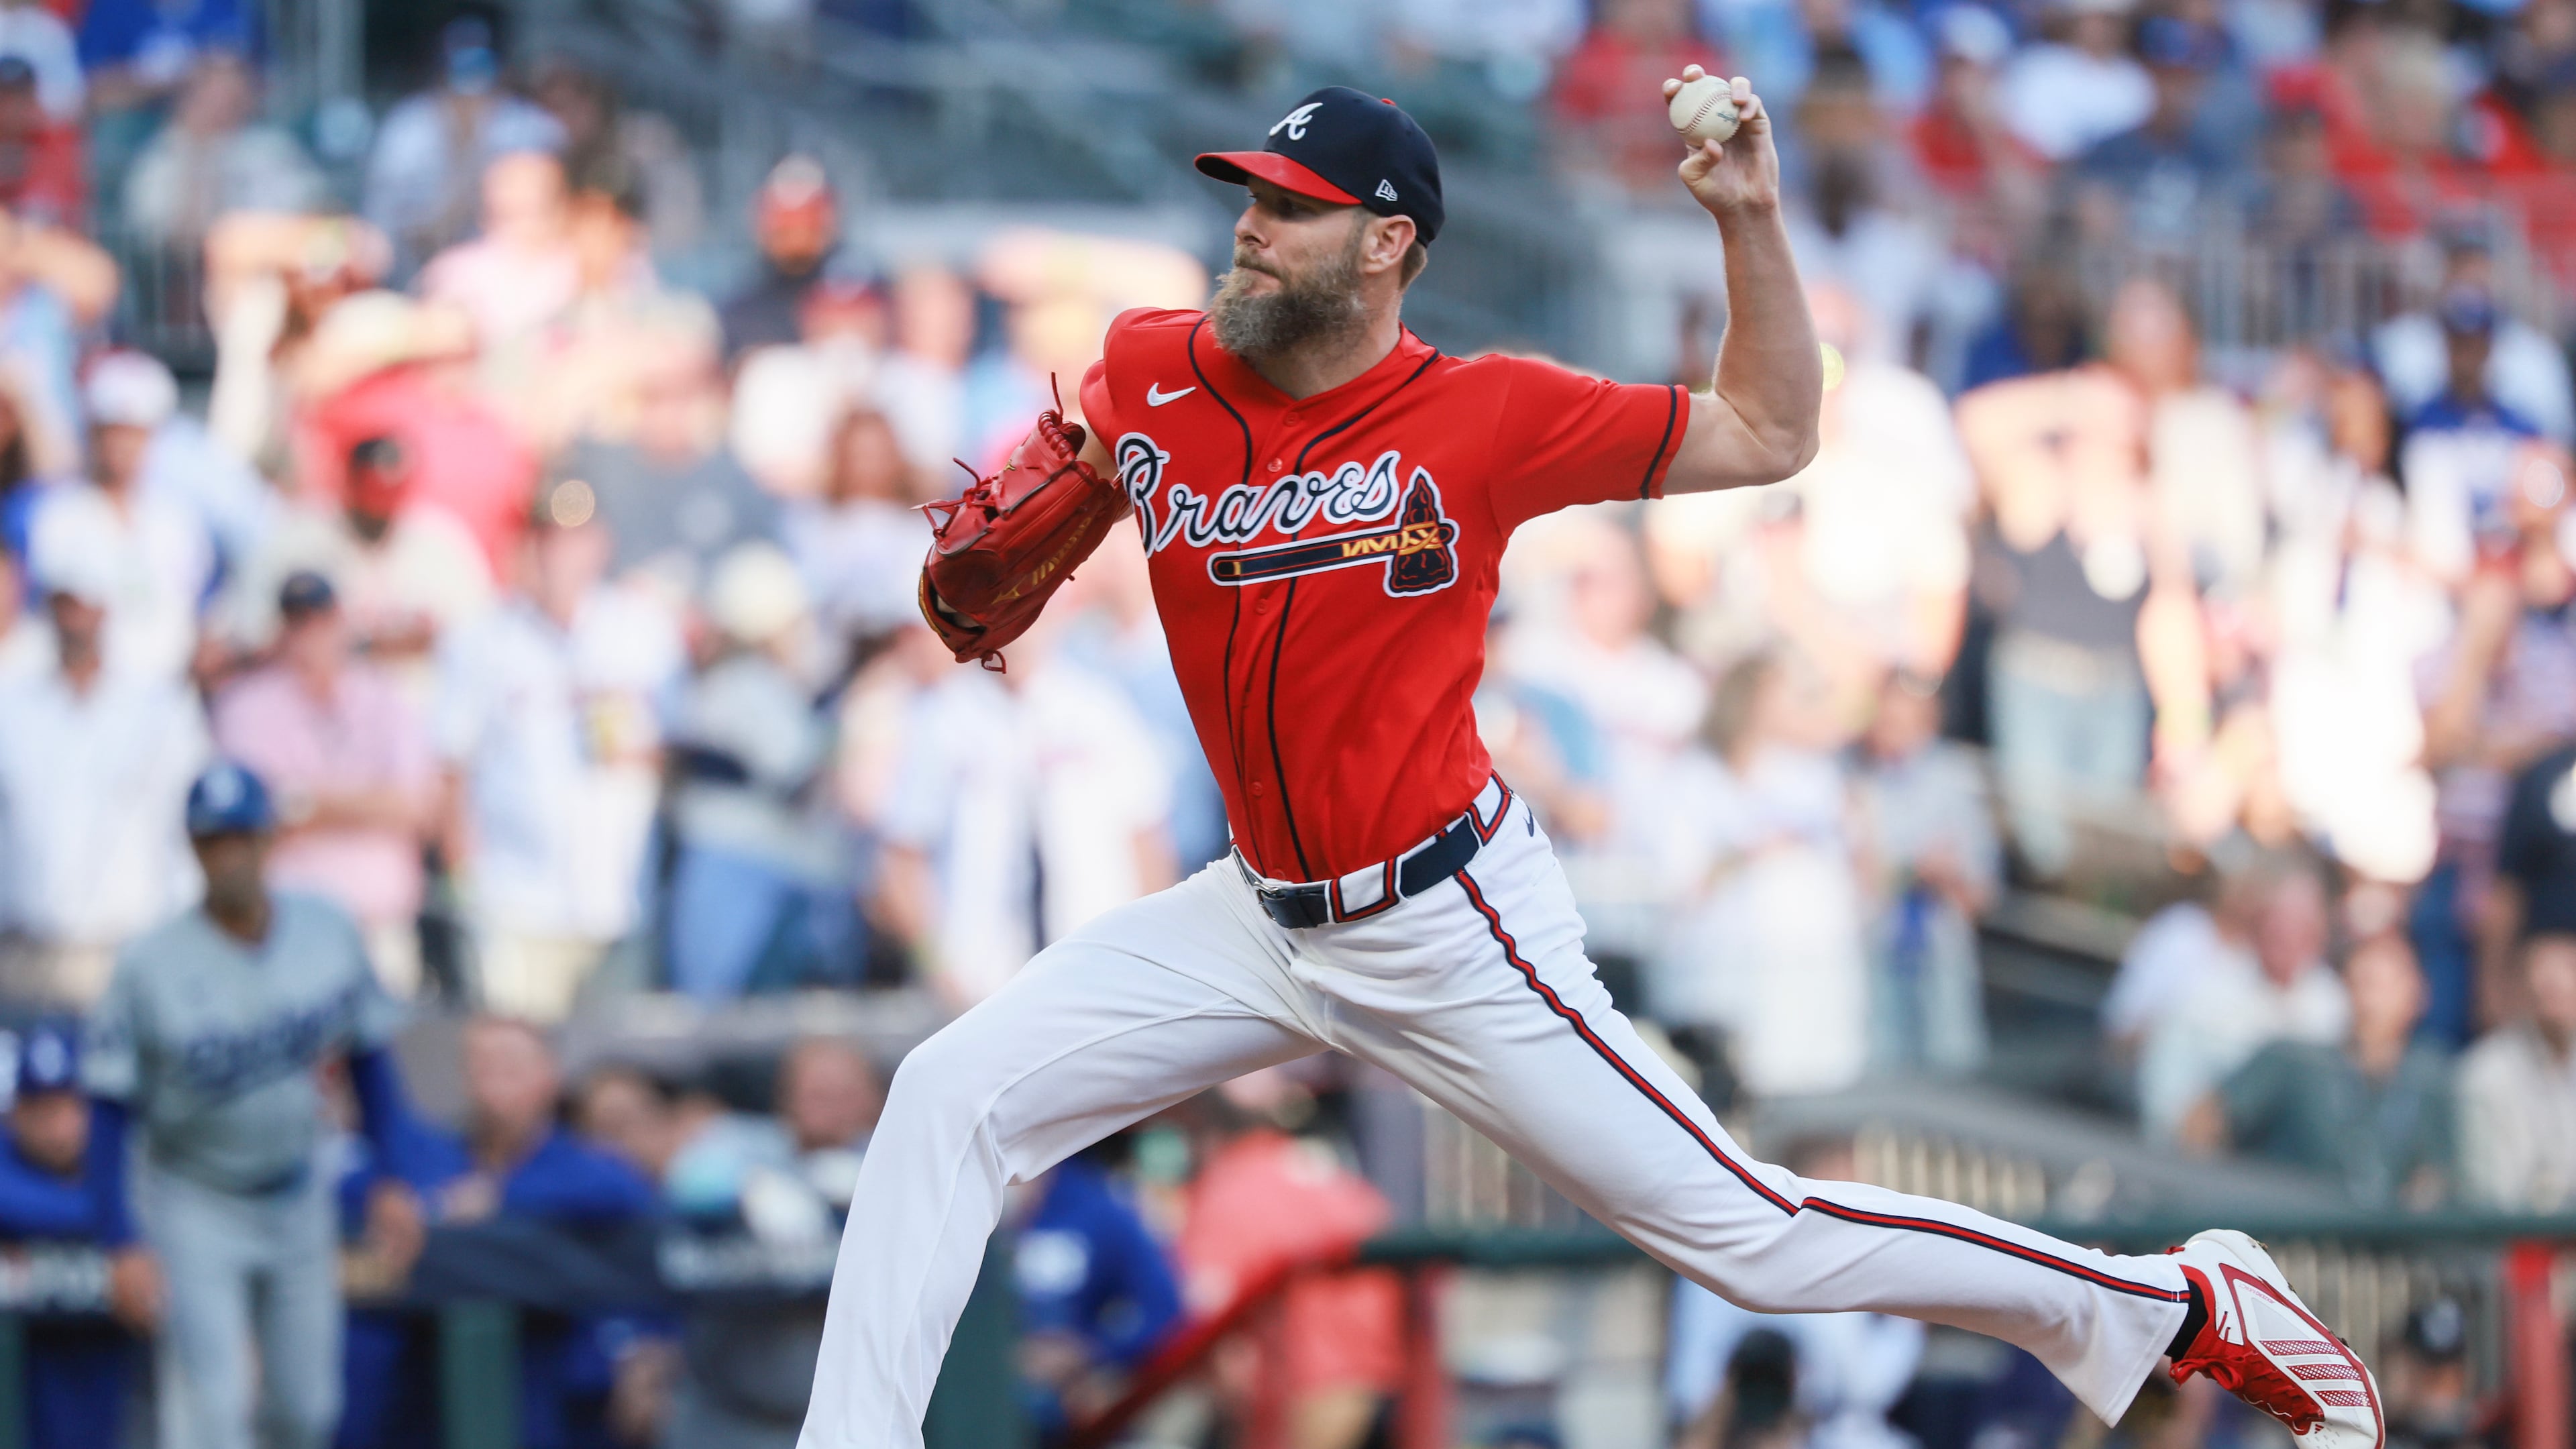
Braves pitcher Chris Sale delivers to a Dodgers batter during Game 3 of their National League Division Series on Tuesday, Oct. 6, 2026, in Atlanta. (Jason Getz/AJC)

By Ken Sugiura
Attempting to take a 2-1 lead in the best-of-five National League Division Series, the Braves were unsuccessful, losing 3-1 to the Los Angeles Dodgers on Tuesday night at Truist Park.
A statistical look inside the game:
- 1: The number of earned runs allowed by Dodgers starter Yoshinobu Yamamoto in his seven-inning outing. It was his fifth consecutive postseason start in which he gave up one or fewer earned runs and his seventh time in 10 postseason starts.
- .438: Michael Harris II’s batting average in eight playoff games in 2024 and this season (14-for-32), along with a .455 on-base percentage and .750 slugging percentage.
- .339: The Braves’ slugging percentage in six playoff games this year after Tuesday’s loss, in which they had one extra-base hit (a ninth-inning double by Ozzie Albies). The Braves’ slugging percentage in the regular season was .409, the seventh-highest in MLB.
- 18-26: The Braves’ all-time record in Game 3 of a postseason series, the fifth-lowest winning percentage (.409) in MLB.
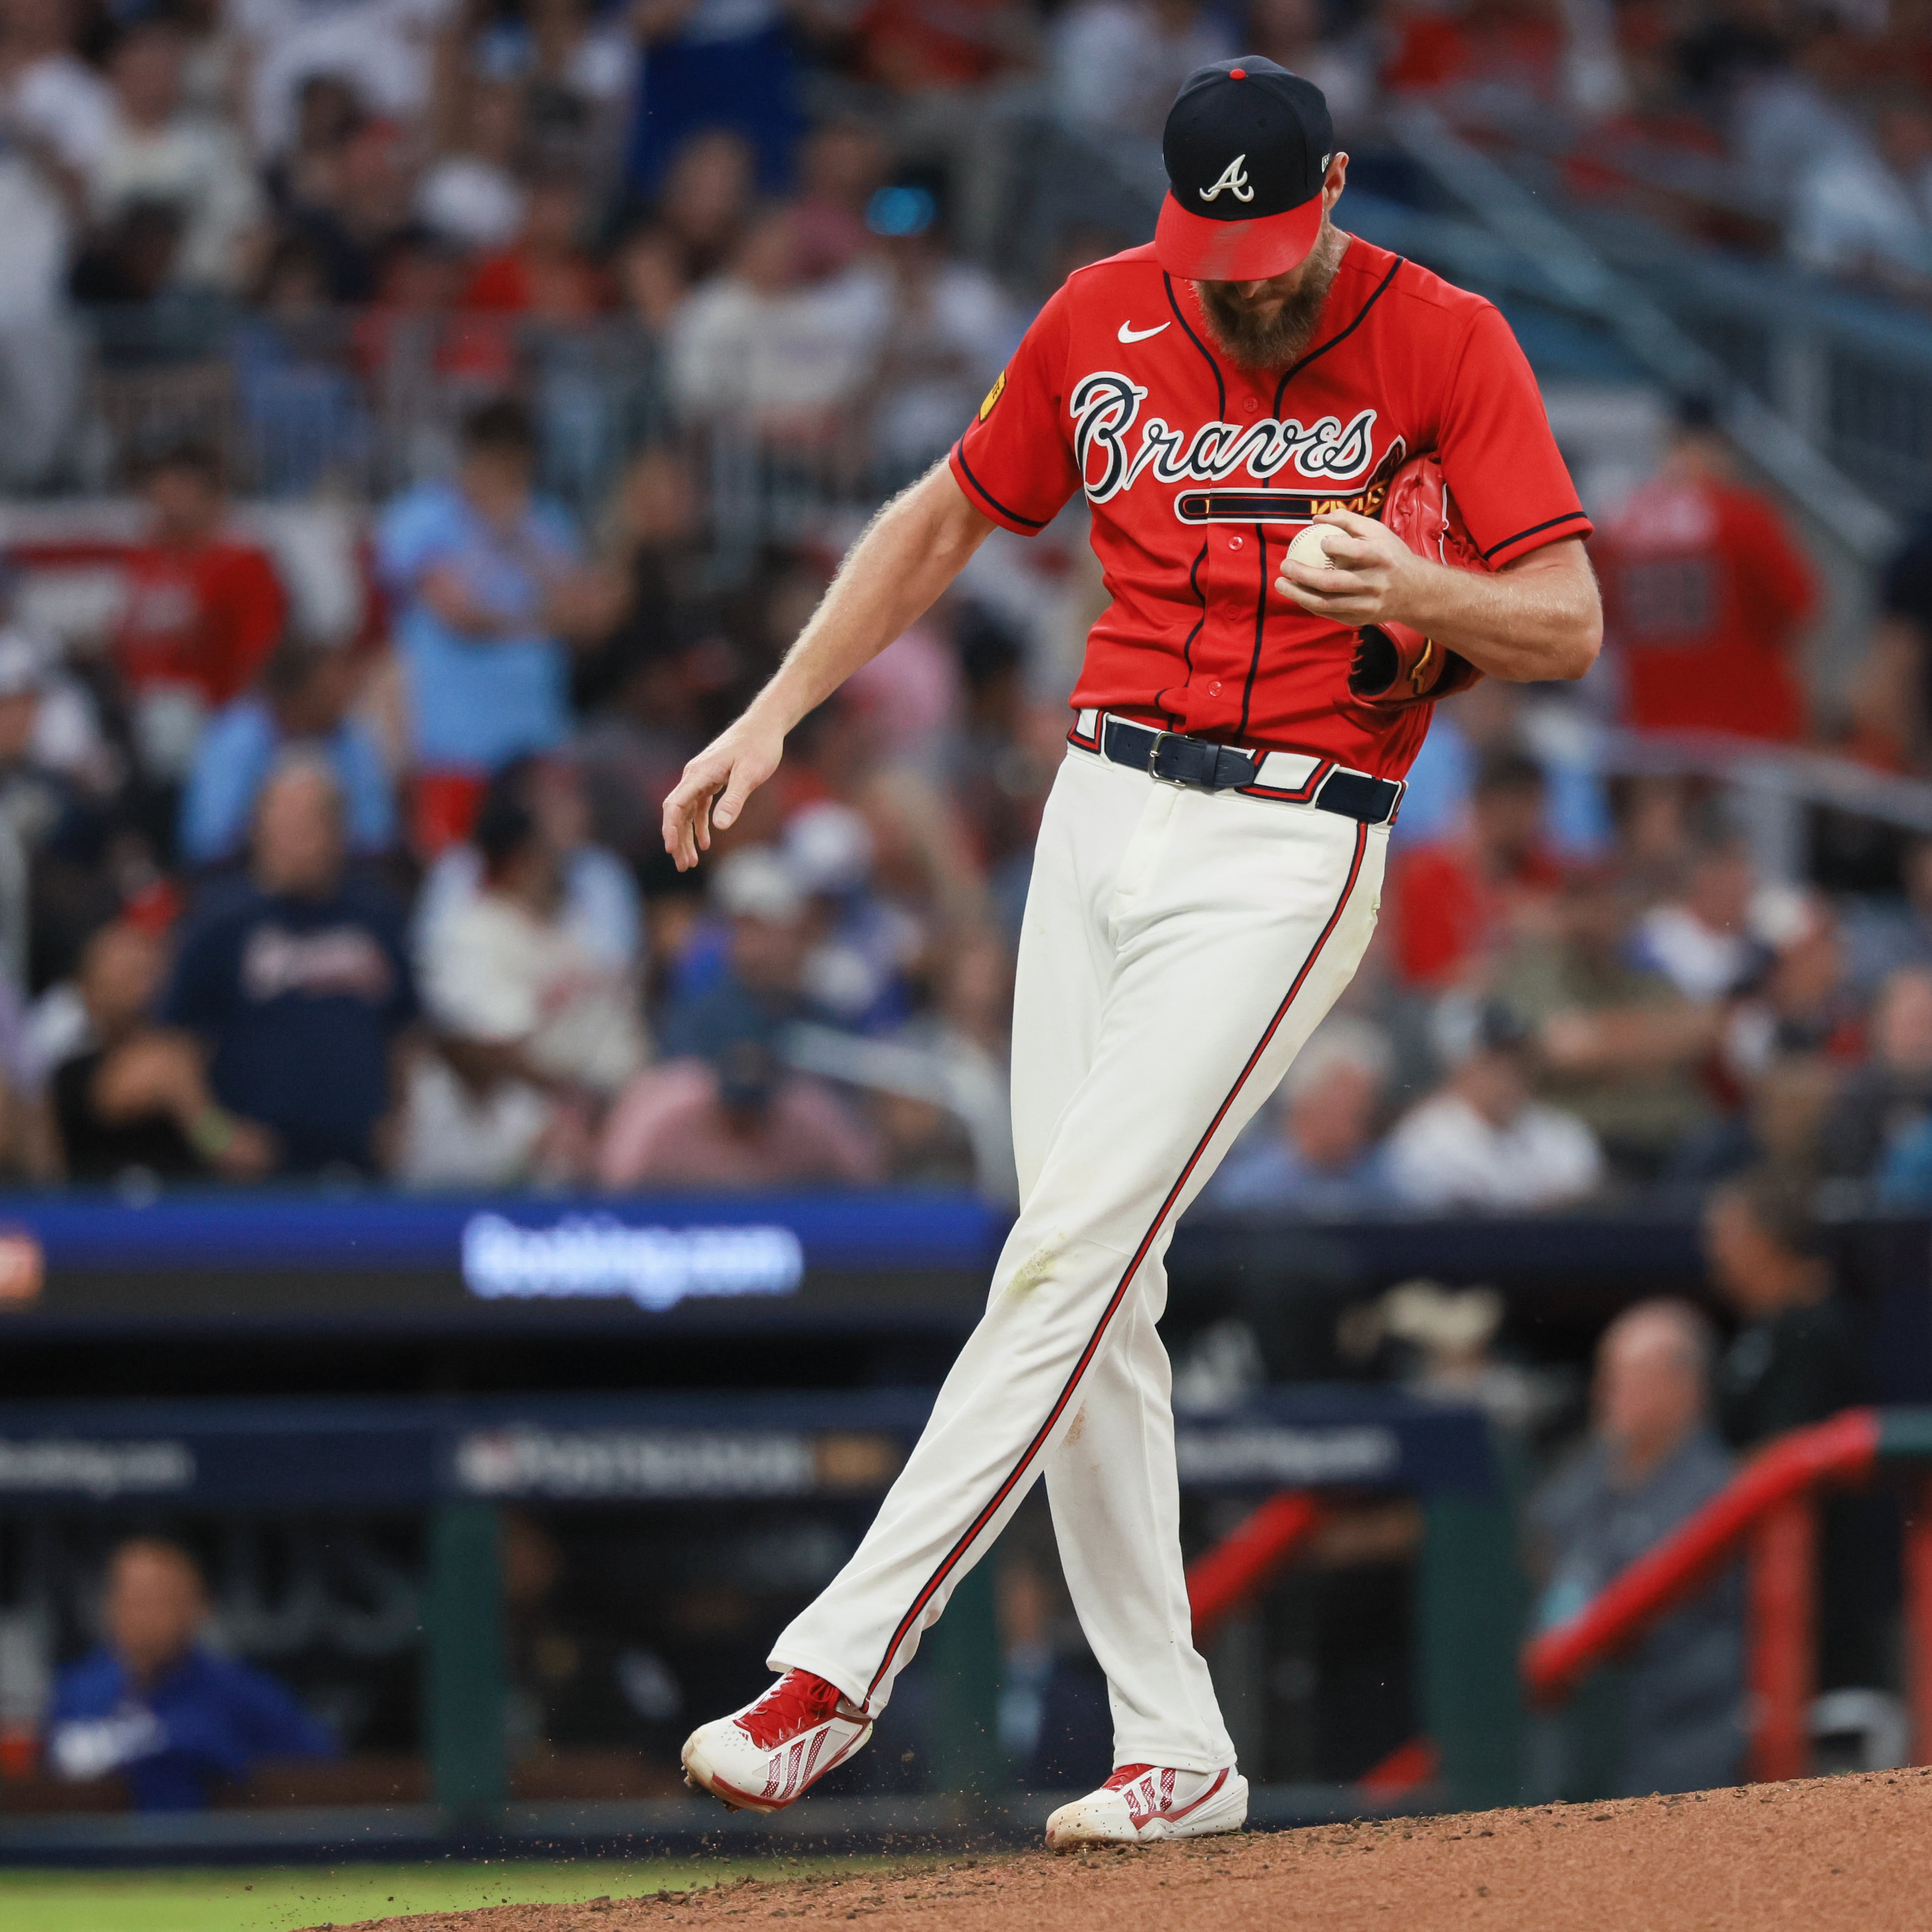
- 5.79: Braves starter Chris Sale’s career ERA in the postseason across 46⅔ innings. Sale allowed three earned runs in five innings Tuesday.

You can now get my column sent straight to your inbox. Sign up for my newsletter here.