Maxwell playoff projections after Week 11
Below are the current Maxwell Ratings' playoff projections for each class.
The Maxwell Ratings playoff projections are based on a Monte Carlo simulation of the 2017 season. The simulation completed 1,000,000 seasons.
While the Maxwell Ratings reflect each team’s strength, the simulation highlights the impact of the season’s structure as defined by the games, region alignments, and playoff brackets.
All out of state opponents were considered equal to the average of the GHSA team’s classification (i.e., out of state opponents of Class AAAAAAA GHSA teams were treated as an average Class AAAAAAA team).
Although regions may use different criteria, in the simulation all standings were determined by 1) region record, 2) head to head, 3) point differential, 4) classification record, and 5) random tie breaker.
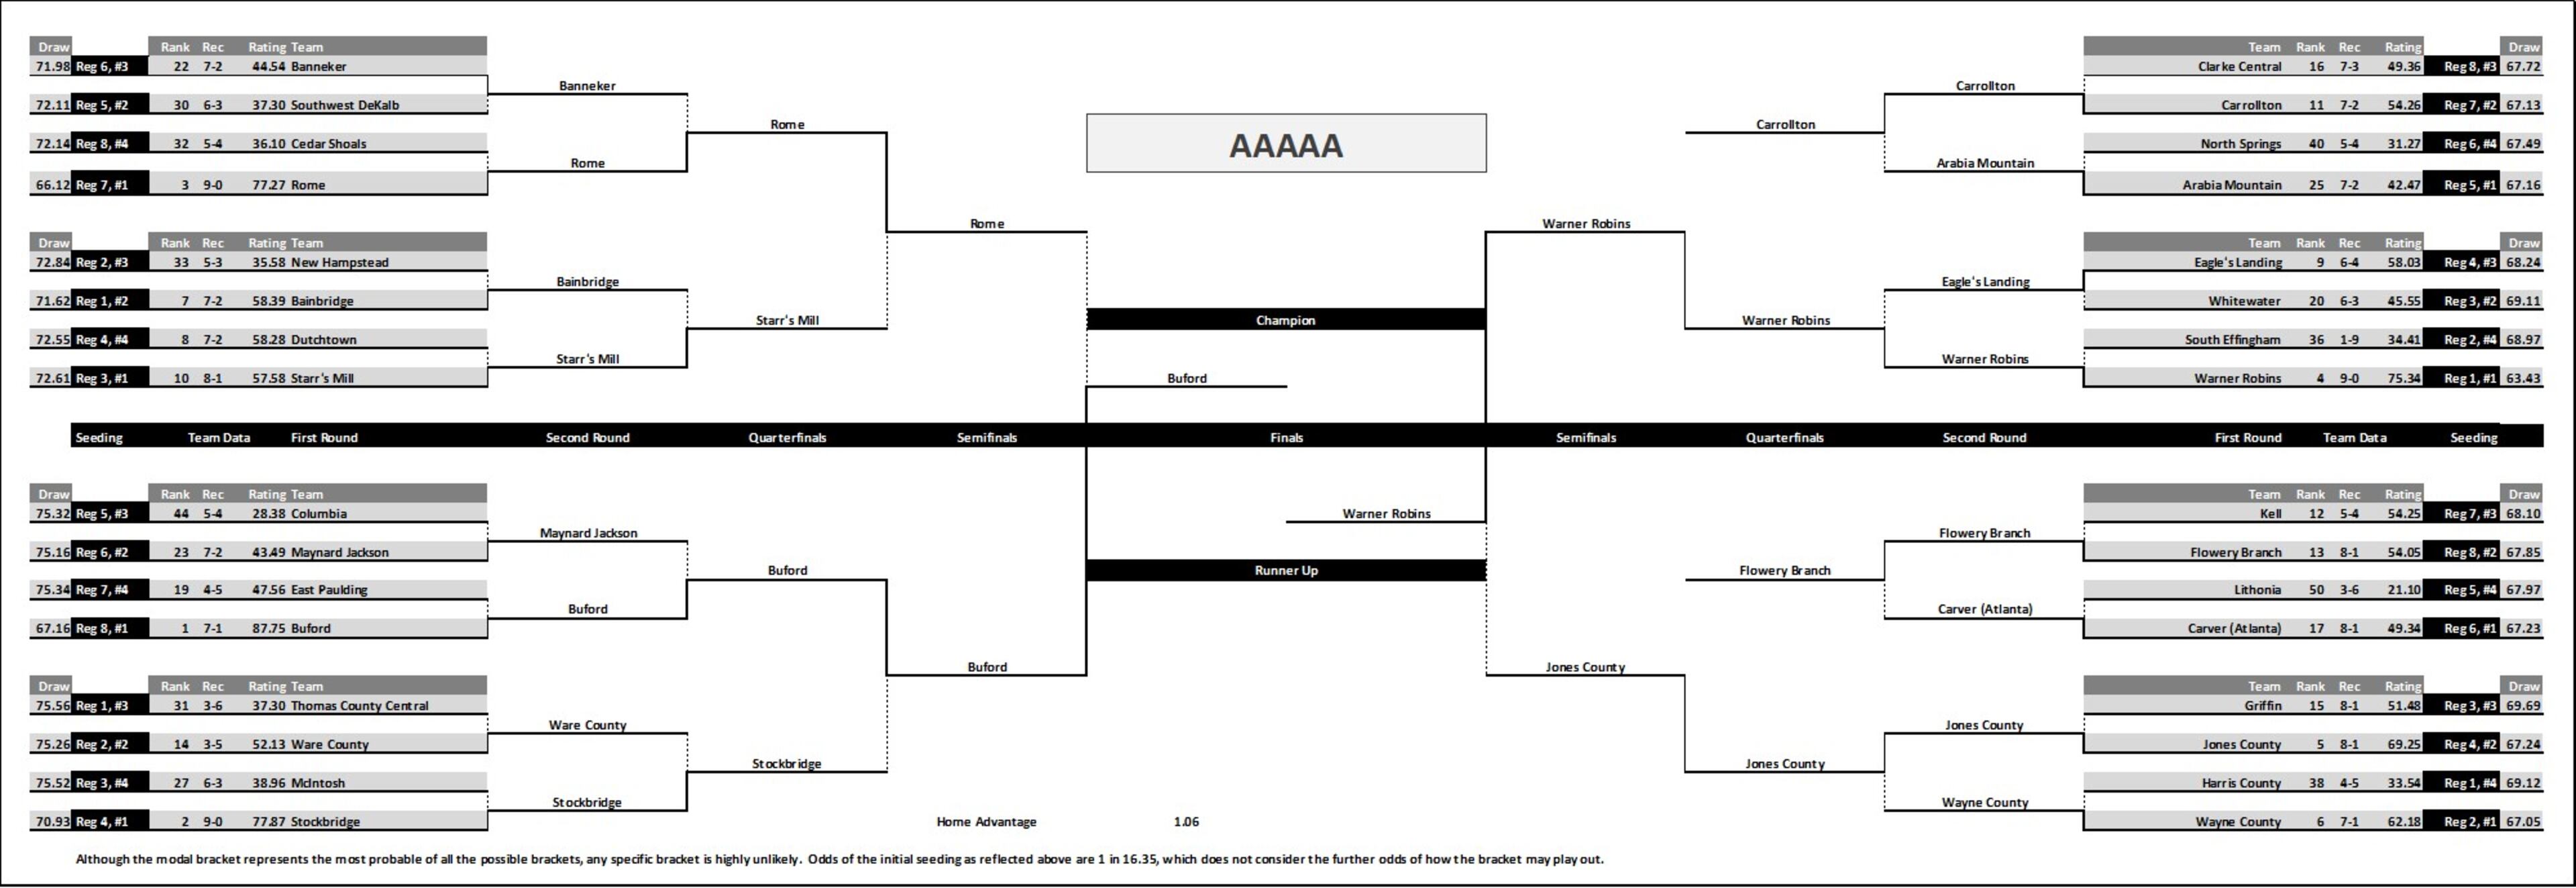
Class AAAAAAA
Modal Bracket
Although any specific bracket is highly unlikely, the modal bracket represents the most probable of all the possible brackets.

Playoff Projections by Region
Each region is shown with the number of times it has teams represented in the semifinals and the finals and the number of times a representative of the region won the state championship along with the associated odds.
| Teams in Semifinals | Teams in Finals | |||||||||
|---|---|---|---|---|---|---|---|---|---|---|
| Region | Eliminated | 1+ | 2+ | 3+ | 4 | Eliminated | 1+ | 2 | Champion | Odds |
| 1 - AAAAAAA | 79,384 | 920,616 | 406,156 | 33,066 | 135 | 271,590 | 728,410 | 136,208 | 557,611 | 0.79 |
| 8 - AAAAAAA | 288,114 | 711,886 | 217,299 | 3,086 | 3 | 604,880 | 395,120 | 45,141 | 190,974 | 4.24 |
| 4 - AAAAAAA | 533,355 | 466,645 | 23,420 | 64 | - | 696,324 | 303,676 | 549 | 123,686 | 7.08 |
| 6 - AAAAAAA | 583,997 | 416,003 | 14,766 | 83 | - | 875,347 | 124,653 | 942 | 57,429 | 16.41 |
| 7 - AAAAAAA | 534,619 | 465,381 | 16,521 | 109 | - | 805,548 | 194,452 | 1,402 | 54,799 | 17.25 |
| 5 - AAAAAAA | 872,145 | 127,855 | 4,287 | 30 | - | 961,890 | 38,110 | 186 | 10,286 | 96.22 |
| 3 - AAAAAAA | 846,013 | 153,987 | 7,418 | 102 | - | 969,483 | 30,517 | 143 | 5,188 | 191.75 |
| 2 - AAAAAAA | 988,928 | 11,072 | 3 | - | - | 999,509 | 491 | - | 27 | 37,036.04 |
Playoff Projections by Team
Each team is shown with its region, rating, the number of times making it to the finals, and the number of times of winning the state championship along with the associated odds.
| Team | Region | Record | Rating | Playoffs | Avg Depth | Qtrfinals | Semifinals | Finals | Champion | Odds |
|---|---|---|---|---|---|---|---|---|---|---|
| Lowndes | 1 - AAAAAAA | 10-0 | 95.81 | 1,000,000 | 4.94 | 942,264 | 849,880 | 654,970 | 497,673 | 1.01 |
| Walton | 4 - AAAAAAA | 9-0 | 87.78 | 1,000,000 | 3.57 | 750,243 | 461,388 | 302,358 | 123,494 | 7.10 |
| Grayson | 8 - AAAAAAA | 8-1 | 87.33 | 1,000,000 | 3.19 | 535,298 | 481,866 | 167,019 | 96,058 | 9.41 |
| Archer | 8 - AAAAAAA | 9-0 | 85.49 | 1,000,000 | 3.59 | 824,397 | 436,479 | 270,620 | 94,417 | 9.59 |
| North Gwinnett | 6 - AAAAAAA | 8-1 | 83.69 | 1,000,000 | 2.99 | 450,472 | 393,479 | 117,705 | 56,481 | 16.71 |
| Tift County | 1 - AAAAAAA | 8-1 | 83.26 | 1,000,000 | 3.36 | 738,747 | 415,541 | 177,040 | 53,787 | 17.59 |
| Brookwood | 7 - AAAAAAA | 7-2 | 82.19 | 1,000,000 | 3.43 | 789,624 | 444,925 | 188,128 | 53,117 | 17.83 |
| South Forsyth | 5 - AAAAAAA | 9-0 | 76.74 | 1,000,000 | 2.59 | 561,651 | 94,695 | 32,232 | 9,685 | 102.25 |
| Colquitt County | 1 - AAAAAAA | 7-3 | 76.50 | 1,000,000 | 2.33 | 279,012 | 94,514 | 32,606 | 6,151 | 161.58 |
| McEachern | 3 - AAAAAAA | 7-2 | 74.63 | 1,000,000 | 2.19 | 216,801 | 87,522 | 23,429 | 4,274 | 232.97 |
| Parkview | 7 - AAAAAAA | 6-3 | 72.37 | 1,000,000 | 1.90 | 266,991 | 28,166 | 6,913 | 1,579 | 632.31 |
| Mill Creek | 6 - AAAAAAA | 6-3 | 70.97 | 1,000,000 | 1.85 | 135,247 | 30,354 | 7,189 | 906 | 1,102.75 |
| Hillgrove | 3 - AAAAAAA | 6-3 | 67.86 | 1,000,000 | 1.93 | 181,284 | 34,279 | 4,320 | 595 | 1,679.67 |
| Milton | 5 - AAAAAAA | 7-2 | 69.57 | 1,000,000 | 1.77 | 131,233 | 33,073 | 5,596 | 578 | 1,729.10 |
| Newton | 8 - AAAAAAA | 6-3 | 69.81 | 1,000,000 | 1.57 | 156,901 | 13,514 | 2,606 | 499 | 2,003.01 |
| North Paulding | 3 - AAAAAAA | 7-2 | 65.48 | 1,000,000 | 1.60 | 213,289 | 24,157 | 1,984 | 250 | 3,999.00 |
| Lassiter | 4 - AAAAAAA | 6-3 | 63.85 | 729,698 | 1.31 | 204,777 | 20,619 | 1,383 | 157 | 6,368.43 |
| Norcross | 7 - AAAAAAA | 4-5 | 66.71 | 1,000,000 | 1.13 | 21,232 | 8,707 | 808 | 102 | 9,802.92 |
| Marietta | 3 - AAAAAAA | 6-3 | 61.10 | 993,116 | 1.63 | 139,804 | 11,125 | 692 | 53 | 18,866.92 |
| Mountain View | 6 - AAAAAAA | 8-2 | 62.85 | 1,000,000 | 1.42 | 46,922 | 6,573 | 674 | 42 | 23,808.52 |
| Woodstock | 4 - AAAAAAA | 6-3 | 60.61 | 1,000,000 | 1.42 | 78,164 | 6,800 | 424 | 32 | 31,249.00 |
| Westlake | 2 - AAAAAAA | 6-3 | 58.05 | 1,000,000 | 1.65 | 165,095 | 10,670 | 479 | 27 | 37,036.04 |
| West Forsyth | 5 - AAAAAAA | 7-2 | 61.47 | 1,000,000 | 1.42 | 52,005 | 4,261 | 467 | 23 | 43,477.26 |
| North Cobb | 3 - AAAAAAA | 5-4 | 59.77 | 825,387 | 1.10 | 64,911 | 4,425 | 235 | 16 | 62,499.00 |
| Etowah | 4 - AAAAAAA | 4-5 | 56.55 | 1,000,000 | 1.19 | 9,051 | 919 | 38 | 2 | 499,999.00 |
| Roswell | 4 - AAAAAAA | 2-7 | 56.44 | 343,581 | 0.41 | 5,374 | 404 | 22 | 1 | 999,999.00 |
| Meadowcreek | 7 - AAAAAAA | 7-2 | 51.05 | 1,000,000 | 1.03 | 3,407 | 180 | 5 | 1 | 999,999.00 |
| Collins Hill | 6 - AAAAAAA | 5-4 | 56.15 | 823,162 | 0.95 | 16,679 | 446 | 27 | - | - |
| South Gwinnett | 8 - AAAAAAA | 3-6 | 52.28 | 1,000,000 | 1.05 | 6,815 | 415 | 16 | - | - |
| Pebblebrook | 2 - AAAAAAA | 5-4 | 51.52 | 1,000,000 | 1.09 | 4,174 | 230 | 12 | - | - |
| Camden County | 1 - AAAAAAA | 3-6 | 53.97 | 16,695 | 0.03 | 754 | 41 | 2 | - | - |
| North Forsyth | 5 - AAAAAAA | 5-4 | 48.98 | 1,000,000 | 1.03 | 938 | 144 | 1 | - | - |
| East Coweta | 2 - AAAAAAA | 5-4 | 48.36 | 398,119 | 0.43 | 3,144 | 96 | - | - | - |
| Newnan | 2 - AAAAAAA | 3-6 | 44.09 | 685,532 | 0.70 | 1,003 | 43 | - | - | - |
| Campbell | 2 - AAAAAAA | 4-5 | 45.78 | 985,080 | 0.99 | 759 | 37 | - | - | - |
| Central Gwinnett | 7 - AAAAAAA | 5-4 | 51.94 | 22,459 | 0.03 | 1,342 | 33 | - | - | - |
| Peachtree Ridge | 6 - AAAAAAA | 2-7 | 40.09 | 176,882 | 0.18 | 193 | - | - | - | - |
| Kennesaw Mountain | 3 - AAAAAAA | 4-5 | 45.17 | 289 | 0.00 | 3 | - | - | - | - |
| Lambert | 5 - AAAAAAA | 2-7 | 39.45 | - | - | - | - | - | - | - |
| Wheeler | 2 - AAAAAAA | 2-7 | 34.09 | - | - | - | - | - | - | - |
| Shiloh | 8 - AAAAAAA | 1-8 | 32.67 | - | - | - | - | - | - | - |
| Duluth | 6 - AAAAAAA | 3-6 | 27.69 | - | - | - | - | - | - | - |
| Rockdale County | 8 - AAAAAAA | 1-8 | 26.80 | - | - | - | - | - | - | - |
| Forsyth Central | 5 - AAAAAAA | 0-9 | 26.19 | - | - | - | - | - | - | - |
| Cherokee | 4 - AAAAAAA | 0-9 | 22.45 | - | - | - | - | - | - | - |
| Lakeside (Atlanta) | 7 - AAAAAAA | 2-7 | 16.10 | - | - | - | - | - | - | - |
| Discovery | 6 - AAAAAAA | 1-8 | 13.09 | - | - | - | - | - | - | - |
| Berkmar | 7 - AAAAAAA | 0-10 | -12.82 | - | - | - | - | - | - | - |
Playoff Seeding Projections
Each team is shown with its region and the number of times of capturing each seed in the region plus the number of times the team did not make the playoffs.
| Region | Team | 1 | 2 | 3 | 4 | At Large | Out |
|---|---|---|---|---|---|---|---|
| 1 - AAAAAAA | Lowndes | 1,000,000 | - | - | - | - | - |
| 1 - AAAAAAA | Tift County | - | 955,957 | 30,262 | - | 13,781 | - |
| 1 - AAAAAAA | Colquitt County | - | 43,150 | 956,850 | - | - | - |
| 1 - AAAAAAA | Camden County | - | 893 | 12,888 | - | 2,914 | 983,305 |
| 2 - AAAAAAA | Westlake | 1,000,000 | - | - | - | - | - |
| 2 - AAAAAAA | Pebblebrook | - | 1,000,000 | - | - | - | - |
| 2 - AAAAAAA | Newnan | - | - | 670,612 | 14,920 | - | 314,468 |
| 2 - AAAAAAA | East Coweta | - | - | 209,985 | 119,403 | 68,731 | 601,881 |
| 2 - AAAAAAA | Campbell | - | - | 119,403 | 865,677 | - | 14,920 |
| 2 - AAAAAAA | Wheeler | - | - | - | - | - | 1,000,000 |
| 3 - AAAAAAA | McEachern | 647,916 | 352,084 | - | - | - | - |
| 3 - AAAAAAA | Hillgrove | 352,084 | 383,706 | 264,210 | - | - | - |
| 3 - AAAAAAA | Marietta | - | 264,210 | 144,444 | 98,762 | 485,700 | 6,884 |
| 3 - AAAAAAA | North Paulding | - | - | 591,346 | 408,654 | - | - |
| 3 - AAAAAAA | North Cobb | - | - | - | 492,584 | 332,803 | 174,613 |
| 3 - AAAAAAA | Kennesaw Mountain | - | - | - | - | 289 | 999,711 |
| 4 - AAAAAAA | Walton | 946,040 | 53,960 | - | - | - | - |
| 4 - AAAAAAA | Woodstock | 53,960 | 320,646 | 625,394 | - | - | - |
| 4 - AAAAAAA | Lassiter | - | 625,394 | 35,695 | 11,846 | 56,763 | 270,302 |
| 4 - AAAAAAA | Etowah | - | - | 338,911 | 661,089 | - | - |
| 4 - AAAAAAA | Roswell | - | - | - | 327,065 | 16,516 | 656,419 |
| 4 - AAAAAAA | Cherokee | - | - | - | - | - | 1,000,000 |
| 5 - AAAAAAA | South Forsyth | 879,714 | 61,427 | 58,859 | - | - | - |
| 5 - AAAAAAA | West Forsyth | 120,286 | 145,683 | 734,031 | - | - | - |
| 5 - AAAAAAA | Milton | - | 789,981 | 163,019 | 47,000 | - | - |
| 5 - AAAAAAA | North Forsyth | - | 2,909 | 44,091 | 953,000 | - | - |
| 5 - AAAAAAA | Lambert | - | - | - | - | - | 1,000,000 |
| 5 - AAAAAAA | Forsyth Central | - | - | - | - | - | 1,000,000 |
| 6 - AAAAAAA | North Gwinnett | 1,000,000 | - | - | - | - | - |
| 6 - AAAAAAA | Mill Creek | - | 813,837 | 176,882 | 9,281 | - | - |
| 6 - AAAAAAA | Mountain View | - | 176,882 | 823,118 | - | - | - |
| 6 - AAAAAAA | Collins Hill | - | 9,281 | - | 813,837 | 44 | 176,838 |
| 6 - AAAAAAA | Peachtree Ridge | - | - | - | 176,882 | - | 823,118 |
| 6 - AAAAAAA | Discovery | - | - | - | - | - | 1,000,000 |
| 6 - AAAAAAA | Duluth | - | - | - | - | - | 1,000,000 |
| 7 - AAAAAAA | Brookwood | 1,000,000 | - | - | - | - | - |
| 7 - AAAAAAA | Parkview | - | 1,000,000 | - | - | - | - |
| 7 - AAAAAAA | Norcross | - | - | 847,223 | 152,777 | - | - |
| 7 - AAAAAAA | Meadowcreek | - | - | 152,777 | 847,223 | - | - |
| 7 - AAAAAAA | Central Gwinnett | - | - | - | - | 22,459 | 977,541 |
| 7 - AAAAAAA | Lakeside (Atlanta) | - | - | - | - | - | 1,000,000 |
| 7 - AAAAAAA | Berkmar | - | - | - | - | - | 1,000,000 |
| 8 - AAAAAAA | Archer | 1,000,000 | - | - | - | - | - |
| 8 - AAAAAAA | Grayson | - | 997,105 | 1,327 | 1,568 | - | - |
| 8 - AAAAAAA | South Gwinnett | - | 2,895 | 1,204 | 995,901 | - | - |
| 8 - AAAAAAA | Newton | - | - | 997,469 | 2,531 | - | - |
| 8 - AAAAAAA | Shiloh | - | - | - | - | - | 1,000,000 |
| 8 - AAAAAAA | Rockdale County | - | - | - | - | - | 1,000,000 |
Class AAAAAA
Modal Bracket
Although any specific bracket is highly unlikely, the modal bracket represents the most probable of all the possible brackets.

Playoff Projections by Region
Each region is shown with the number of times it has teams represented in the semifinals and the finals and the number of times a representative of the region won the state championship along with the associated odds.
| Teams in Semifinals | Teams in Finals | |||||||||
|---|---|---|---|---|---|---|---|---|---|---|
| Region | Eliminated | 1+ | 2+ | 3+ | 4 | Eliminated | 1+ | 2 | Champion | Odds |
| 1 - AAAAAA | 200,104 | 799,896 | 355,740 | 58,488 | 2,650 | 379,897 | 620,103 | 135,094 | 436,459 | 1.29 |
| 2 - AAAAAA | 356,873 | 643,127 | 194,289 | 21,742 | 527 | 616,501 | 383,499 | 41,562 | 206,519 | 3.84 |
| 5 - AAAAAA | 479,262 | 520,738 | 71,269 | 2,923 | 35 | 685,094 | 314,906 | 12,397 | 178,536 | 4.60 |
| 6 - AAAAAA | 495,097 | 504,903 | 82,220 | 4,632 | 60 | 800,122 | 199,878 | 8,991 | 81,209 | 11.31 |
| 4 - AAAAAA | 631,425 | 368,575 | 31,543 | 232 | - | 807,807 | 192,193 | 1,988 | 80,303 | 11.45 |
| 7 - AAAAAA | 874,322 | 125,678 | 2,142 | 6 | - | 964,043 | 35,957 | 42 | 7,315 | 135.71 |
| 8 - AAAAAA | 873,679 | 126,321 | 3,183 | 24 | - | 963,131 | 36,869 | 45 | 7,262 | 136.70 |
| 3 - AAAAAA | 921,931 | 78,069 | 988 | 2 | - | 983,562 | 16,438 | 38 | 2,397 | 416.19 |
Playoff Projections by Team
Each team is shown with its region, rating, the number of times making it to the finals, and the number of times of winning the state championship along with the associated odds.
| Team | Region | Record | Rating | Playoffs | Avg Depth | Qtrfinals | Semifinals | Finals | Champion | Odds |
|---|---|---|---|---|---|---|---|---|---|---|
| Coffee | 1 - AAAAAA | 6-2 | 73.31 | 1,000,000 | 3.92 | 790,551 | 579,653 | 416,520 | 286,678 | 2.49 |
| Mays | 5 - AAAAAA | 8-1 | 69.98 | 1,000,000 | 3.54 | 800,153 | 431,920 | 279,605 | 167,889 | 4.96 |
| Lee County | 1 - AAAAAA | 8-1 | 68.39 | 1,000,000 | 2.79 | 509,420 | 328,149 | 209,579 | 101,812 | 8.82 |
| Glynn Academy | 2 - AAAAAA | 5-3 | 68.79 | 1,000,000 | 2.70 | 435,257 | 333,268 | 195,651 | 101,400 | 8.86 |
| Tucker | 4 - AAAAAA | 8-1 | 65.66 | 1,000,000 | 3.00 | 457,955 | 333,076 | 181,287 | 77,722 | 11.87 |
| Brunswick | 2 - AAAAAA | 6-2 | 66.96 | 1,000,000 | 2.82 | 528,128 | 353,110 | 158,586 | 81,138 | 11.32 |
| Harrison | 6 - AAAAAA | 7-2 | 64.27 | 1,000,000 | 3.17 | 743,889 | 385,289 | 141,807 | 65,745 | 14.21 |
| Northside (Warner Robins) | 1 - AAAAAA | 7-3 | 63.97 | 1,000,000 | 2.22 | 339,375 | 241,651 | 112,339 | 41,901 | 22.87 |
| Richmond Hill | 2 - AAAAAA | 7-1 | 62.42 | 1,000,000 | 1.82 | 250,873 | 154,359 | 66,609 | 23,196 | 42.11 |
| Douglas County | 5 - AAAAAA | 8-1 | 57.20 | 1,000,000 | 2.01 | 331,150 | 105,887 | 36,111 | 8,652 | 114.58 |
| Dalton | 6 - AAAAAA | 7-2 | 56.89 | 1,000,000 | 2.05 | 344,709 | 101,243 | 35,128 | 8,394 | 118.13 |
| Dacula | 8 - AAAAAA | 5-4 | 54.74 | 1,000,000 | 2.48 | 427,124 | 107,767 | 34,682 | 7,038 | 141.09 |
| Alpharetta | 7 - AAAAAA | 8-1 | 55.05 | 1,000,000 | 2.29 | 359,891 | 112,713 | 34,049 | 7,077 | 140.30 |
| Allatoona | 6 - AAAAAA | 6-3 | 55.92 | 1,000,000 | 1.96 | 310,897 | 87,482 | 27,801 | 6,169 | 161.10 |
| Valdosta | 1 - AAAAAA | 3-6 | 59.73 | 815,087 | 1.28 | 144,710 | 66,136 | 16,640 | 6,049 | 164.32 |
| Evans | 3 - AAAAAA | 7-2 | 51.12 | 1,000,000 | 2.02 | 151,069 | 58,170 | 13,298 | 2,011 | 496.27 |
| Stephenson | 4 - AAAAAA | 7-2 | 53.04 | 1,000,000 | 2.00 | 166,600 | 59,553 | 11,814 | 2,448 | 407.50 |
| Hughes | 5 - AAAAAA | 7-3 | 53.04 | 645,128 | 1.03 | 121,708 | 24,239 | 6,307 | 1,115 | 895.86 |
| Alexander | 5 - AAAAAA | 6-3 | 50.56 | 939,096 | 1.34 | 129,944 | 28,330 | 4,824 | 809 | 1,235.09 |
| Effingham County | 2 - AAAAAA | 4-5 | 51.84 | 1,000,000 | 1.22 | 73,324 | 18,947 | 4,215 | 785 | 1,272.89 |
| Sequoyah | 6 - AAAAAA | 5-4 | 52.91 | 988,777 | 1.23 | 88,008 | 17,751 | 4,124 | 900 | 1,110.11 |
| Heritage (Conyers) | 3 - AAAAAA | 6-3 | 47.38 | 1,000,000 | 1.60 | 69,402 | 18,299 | 2,947 | 366 | 2,731.24 |
| Centennial | 7 - AAAAAA | 7-3 | 46.13 | 1,000,000 | 1.69 | 83,477 | 12,098 | 1,803 | 230 | 4,346.83 |
| Winder-Barrow | 8 - AAAAAA | 8-1 | 44.33 | 1,000,000 | 1.50 | 71,378 | 8,343 | 1,094 | 111 | 9,008.01 |
| Lovejoy | 4 - AAAAAA | 6-4 | 46.18 | 1,000,000 | 1.56 | 50,356 | 7,276 | 1,061 | 132 | 7,574.76 |
| Lanier | 8 - AAAAAA | 5-4 | 43.32 | 1,000,000 | 1.41 | 50,303 | 5,881 | 602 | 51 | 19,606.84 |
| Gainesville | 8 - AAAAAA | 4-5 | 42.57 | 1,000,000 | 1.58 | 64,862 | 7,537 | 536 | 62 | 16,128.03 |
| Northgate | 5 - AAAAAA | 6-3 | 46.65 | 415,776 | 0.51 | 30,893 | 4,587 | 456 | 71 | 14,083.51 |
| Grovetown | 3 - AAAAAA | 5-4 | 41.78 | 1,000,000 | 1.33 | 21,847 | 2,486 | 224 | 20 | 49,999.00 |
| Chattahoochee | 7 - AAAAAA | 7-2 | 38.83 | 1,000,000 | 1.38 | 32,524 | 2,724 | 137 | 8 | 124,999.00 |
| Houston County | 1 - AAAAAA | 2-7 | 46.39 | 184,913 | 0.21 | 5,540 | 1,184 | 119 | 19 | 52,630.58 |
| Jonesboro | 4 - AAAAAA | 3-6 | 35.98 | 181,464 | 0.22 | 1,427 | 171 | 9 | 1 | 999,999.00 |
| Creekview | 6 - AAAAAA | 5-4 | 45.73 | 11,223 | 0.01 | 407 | 49 | 9 | 1 | 999,999.00 |
| Drew | 4 - AAAAAA | 3-6 | 33.46 | 427,546 | 0.49 | 2,075 | 209 | 8 | - | - |
| Lakeside (Evans) | 3 - AAAAAA | 2-7 | 31.35 | 1,000,000 | 1.05 | 1,151 | 104 | 7 | - | - |
| Pope | 7 - AAAAAA | 3-6 | 31.75 | 519,943 | 0.57 | 3,788 | 128 | 5 | - | - |
| Cambridge | 7 - AAAAAA | 3-6 | 34.28 | 262,798 | 0.30 | 3,026 | 115 | 4 | - | - |
| M.L. King | 4 - AAAAAA | 3-6 | 29.23 | 390,990 | 0.43 | 940 | 66 | 2 | - | - |
| Johns Creek | 7 - AAAAAA | 3-6 | 32.81 | 217,259 | 0.24 | 1,869 | 50 | 1 | - | - |
| Bradwell Institute | 2 - AAAAAA | 6-3 | 39.52 | - | - | - | - | - | - | - |
| New Manchester | 5 - AAAAAA | 3-6 | 38.63 | - | - | - | - | - | - | - |
| Tri-Cities | 5 - AAAAAA | 2-7 | 36.69 | - | - | - | - | - | - | - |
| South Cobb | 6 - AAAAAA | 2-7 | 35.47 | - | - | - | - | - | - | - |
| River Ridge | 6 - AAAAAA | 3-6 | 33.49 | - | - | - | - | - | - | - |
| Alcovy | 3 - AAAAAA | 3-6 | 30.51 | - | - | - | - | - | - | - |
| Greenbrier | 3 - AAAAAA | 5-4 | 30.40 | - | - | - | - | - | - | - |
| Sprayberry | 6 - AAAAAA | 2-7 | 29.56 | - | - | - | - | - | - | - |
| Habersham Central | 8 - AAAAAA | 1-8 | 28.14 | - | - | - | - | - | - | - |
| Northview | 7 - AAAAAA | 2-7 | 26.37 | - | - | - | - | - | - | - |
| North Atlanta | 7 - AAAAAA | 3-6 | 23.28 | - | - | - | - | - | - | - |
| Mount Zion (Jonesboro) | 4 - AAAAAA | 1-8 | 23.04 | - | - | - | - | - | - | - |
| Mundy's Mill | 4 - AAAAAA | 2-8 | 21.35 | - | - | - | - | - | - | - |
| Creekside | 5 - AAAAAA | 0-9 | 18.48 | - | - | - | - | - | - | - |
| South Paulding | 5 - AAAAAA | 0-9 | 17.11 | - | - | - | - | - | - | - |
| Dunwoody | 7 - AAAAAA | 2-7 | 16.48 | - | - | - | - | - | - | - |
| Apalachee | 8 - AAAAAA | 1-8 | 12.84 | - | - | - | - | - | - | - |
| Forest Park | 4 - AAAAAA | 2-8 | 10.97 | - | - | - | - | - | - | - |
| Osborne | 6 - AAAAAA | 0-8 | -9.92 | - | - | - | - | - | - | - |
Playoff Seeding Projections
Each team is shown with its region and the number of times of capturing each seed in the region plus the number of times the team did not make the playoffs.
| Region | Team | 1 | 2 | 3 | 4 | Out |
|---|---|---|---|---|---|---|
| 1 - AAAAAA | Coffee | 604,259 | 395,741 | - | - | - |
| 1 - AAAAAA | Lee County | 395,741 | 111,589 | 492,670 | - | - |
| 1 - AAAAAA | Northside (Warner Robins) | - | 492,670 | 507,330 | - | - |
| 1 - AAAAAA | Valdosta | - | - | - | 815,087 | 184,913 |
| 1 - AAAAAA | Houston County | - | - | - | 184,913 | 815,087 |
| 2 - AAAAAA | Brunswick | 781,697 | 218,303 | - | - | - |
| 2 - AAAAAA | Glynn Academy | 218,303 | 739,497 | 42,200 | - | - |
| 2 - AAAAAA | Richmond Hill | - | 41,814 | 735,937 | 222,249 | - |
| 2 - AAAAAA | Effingham County | - | 386 | 221,863 | 777,751 | - |
| 2 - AAAAAA | Bradwell Institute | - | - | - | - | 1,000,000 |
| 3 - AAAAAA | Evans | 724,473 | 201,088 | 74,439 | - | - |
| 3 - AAAAAA | Heritage (Conyers) | 275,527 | 243,917 | 480,556 | - | - |
| 3 - AAAAAA | Grovetown | - | 554,995 | 337,566 | 107,439 | - |
| 3 - AAAAAA | Lakeside (Evans) | - | - | 107,439 | 892,561 | - |
| 3 - AAAAAA | Greenbrier | - | - | - | - | 1,000,000 |
| 3 - AAAAAA | Alcovy | - | - | - | - | 1,000,000 |
| 4 - AAAAAA | Tucker | 786,565 | 213,435 | - | - | - |
| 4 - AAAAAA | Stephenson | 213,435 | 786,565 | - | - | - |
| 4 - AAAAAA | Lovejoy | - | - | 1,000,000 | - | - |
| 4 - AAAAAA | Drew | - | - | - | 427,546 | 572,454 |
| 4 - AAAAAA | M.L. King | - | - | - | 390,990 | 609,010 |
| 4 - AAAAAA | Jonesboro | - | - | - | 181,464 | 818,536 |
| 4 - AAAAAA | Mount Zion (Jonesboro) | - | - | - | - | 1,000,000 |
| 4 - AAAAAA | Mundy's Mill | - | - | - | - | 1,000,000 |
| 4 - AAAAAA | Forest Park | - | - | - | - | 1,000,000 |
| 5 - AAAAAA | Mays | 1,000,000 | - | - | - | - |
| 5 - AAAAAA | Douglas County | - | 645,128 | 354,872 | - | - |
| 5 - AAAAAA | Alexander | - | 354,872 | - | 584,224 | 60,904 |
| 5 - AAAAAA | Hughes | - | - | 584,224 | 60,904 | 354,872 |
| 5 - AAAAAA | Northgate | - | - | 60,904 | 354,872 | 584,224 |
| 5 - AAAAAA | Tri-Cities | - | - | - | - | 1,000,000 |
| 5 - AAAAAA | New Manchester | - | - | - | - | 1,000,000 |
| 5 - AAAAAA | Creekside | - | - | - | - | 1,000,000 |
| 5 - AAAAAA | South Paulding | - | - | - | - | 1,000,000 |
| 6 - AAAAAA | Harrison | 1,000,000 | - | - | - | - |
| 6 - AAAAAA | Dalton | - | 558,685 | 441,315 | - | - |
| 6 - AAAAAA | Allatoona | - | 441,315 | 558,685 | - | - |
| 6 - AAAAAA | Sequoyah | - | - | - | 988,777 | 11,223 |
| 6 - AAAAAA | Creekview | - | - | - | 11,223 | 988,777 |
| 6 - AAAAAA | South Cobb | - | - | - | - | 1,000,000 |
| 6 - AAAAAA | River Ridge | - | - | - | - | 1,000,000 |
| 6 - AAAAAA | Sprayberry | - | - | - | - | 1,000,000 |
| 6 - AAAAAA | Osborne | - | - | - | - | 1,000,000 |
| 7 - AAAAAA | Alpharetta | 825,729 | 102,726 | 71,545 | - | - |
| 7 - AAAAAA | Centennial | 164,412 | 835,588 | - | - | - |
| 7 - AAAAAA | Chattahoochee | 9,859 | 61,686 | 928,455 | - | - |
| 7 - AAAAAA | Pope | - | - | - | 519,943 | 480,057 |
| 7 - AAAAAA | Cambridge | - | - | - | 262,798 | 737,202 |
| 7 - AAAAAA | Johns Creek | - | - | - | 217,259 | 782,741 |
| 7 - AAAAAA | Northview | - | - | - | - | 1,000,000 |
| 7 - AAAAAA | North Atlanta | - | - | - | - | 1,000,000 |
| 7 - AAAAAA | Dunwoody | - | - | - | - | 1,000,000 |
| 8 - AAAAAA | Dacula | 850,117 | 143,744 | 6,139 | - | - |
| 8 - AAAAAA | Winder-Barrow | 149,883 | 22,620 | 482,705 | 344,792 | - |
| 8 - AAAAAA | Gainesville | - | 675,379 | 179,689 | 144,932 | - |
| 8 - AAAAAA | Lanier | - | 158,257 | 331,467 | 510,276 | - |
| 8 - AAAAAA | Habersham Central | - | - | - | - | 1,000,000 |
| 8 - AAAAAA | Apalachee | - | - | - | - | 1,000,000 |
Class AAAAA
Modal Bracket
Although any specific bracket is highly unlikely, the modal bracket represents the most probable of all the possible brackets.
Playoff Projections by Region
Each region is shown with the number of times it has teams represented in the semifinals and the finals and the number of times a representative of the region won the state championship along with the associated odds.
| Teams in Semifinals | Teams in Finals | |||||||||
|---|---|---|---|---|---|---|---|---|---|---|
| Region | Eliminated | 1+ | 2+ | 3+ | 4 | Eliminated | 1+ | 2 | Champion | Odds |
| 8 - AAAAA | 249,665 | 750,335 | 96,182 | 2,167 | 1 | 414,281 | 585,719 | 12,341 | 485,659 | 1.06 |
| 1 - AAAAA | 252,518 | 747,482 | 79,436 | 42 | - | 458,352 | 541,648 | 4,096 | 174,086 | 4.74 |
| 7 - AAAAA | 153,659 | 846,341 | 125,234 | 5,014 | 4 | 705,588 | 294,412 | 9,905 | 172,515 | 4.80 |
| 4 - AAAAA | 340,679 | 659,321 | 192,010 | 18,245 | 437 | 619,460 | 380,540 | 39,164 | 153,633 | 5.51 |
| 2 - AAAAA | 683,932 | 316,068 | 1,527 | - | - | 892,554 | 107,446 | 36 | 12,624 | 78.21 |
| 3 - AAAAA | 934,379 | 65,621 | 1,275 | 6 | - | 988,446 | 11,554 | 16 | 1,034 | 966.12 |
| 6 - AAAAA | 924,074 | 75,926 | 460 | - | - | 989,027 | 10,973 | - | 405 | 2,468.14 |
| 5 - AAAAA | 983,152 | 16,848 | 11 | - | - | 997,850 | 2,150 | - | 44 | 22,726.27 |
Playoff Projections by Team
Each team is shown with its region, rating, the number of times making it to the finals, and the number of times of winning the state championship along with the associated odds.
| Team | Region | Record | Rating | Playoffs | Avg Depth | Qtrfinals | Semifinals | Finals | Champion | Odds |
|---|---|---|---|---|---|---|---|---|---|---|
| Buford | 8 - AAAAA | 7-1 | 87.75 | 1,000,000 | 4.76 | 977,096 | 739,675 | 576,430 | 484,510 | 1.06 |
| Warner Robins | 1 - AAAAA | 9-0 | 75.34 | 1,000,000 | 4.23 | 834,676 | 718,561 | 522,721 | 171,471 | 4.83 |
| Rome | 7 - AAAAA | 9-0 | 77.27 | 1,000,000 | 4.20 | 960,685 | 818,906 | 264,368 | 170,223 | 4.87 |
| Stockbridge | 4 - AAAAA | 9-0 | 77.87 | 1,000,000 | 3.47 | 935,465 | 283,228 | 161,712 | 104,308 | 8.59 |
| Jones County | 4 - AAAAA | 8-1 | 69.25 | 1,000,000 | 3.13 | 536,057 | 444,127 | 223,024 | 46,089 | 20.70 |
| Wayne County | 2 - AAAAA | 7-1 | 62.18 | 1,000,000 | 2.81 | 431,380 | 312,711 | 107,077 | 12,577 | 78.51 |
| Bainbridge | 1 - AAAAA | 7-2 | 58.39 | 1,000,000 | 2.50 | 477,578 | 107,869 | 23,001 | 2,615 | 381.41 |
| Eagle's Landing | 4 - AAAAA | 6-4 | 58.03 | 1,000,000 | 1.90 | 154,752 | 74,442 | 23,323 | 1,987 | 502.27 |
| Carrollton | 7 - AAAAA | 7-2 | 54.26 | 1,000,000 | 2.27 | 507,031 | 86,642 | 25,785 | 1,483 | 673.31 |
| Dutchtown | 4 - AAAAA | 7-2 | 58.28 | 1,000,000 | 1.93 | 258,060 | 68,219 | 11,645 | 1,249 | 799.64 |
| Flowery Branch | 8 - AAAAA | 8-1 | 54.05 | 1,000,000 | 1.97 | 334,424 | 81,177 | 16,015 | 961 | 1,039.58 |
| Starr's Mill | 3 - AAAAA | 8-1 | 57.58 | 1,000,000 | 1.74 | 196,337 | 43,896 | 8,347 | 879 | 1,136.66 |
| Kell | 7 - AAAAA | 5-4 | 54.25 | 1,000,000 | 1.84 | 291,547 | 70,254 | 14,103 | 805 | 1,241.24 |
| Carver (Atlanta) | 6 - AAAAA | 8-1 | 49.34 | 1,000,000 | 2.40 | 366,634 | 69,816 | 10,794 | 389 | 2,569.69 |
| Clarke Central | 8 - AAAAA | 7-3 | 49.36 | 1,000,000 | 1.62 | 241,677 | 27,500 | 5,613 | 188 | 5,318.15 |
| Griffin | 3 - AAAAA | 8-1 | 51.48 | 1,000,000 | 1.31 | 66,998 | 17,207 | 2,419 | 137 | 7,298.27 |
| Ware County | 2 - AAAAA | 3-5 | 52.13 | 1,000,000 | 1.85 | 69,291 | 4,392 | 380 | 46 | 21,738.13 |
| Arabia Mountain | 5 - AAAAA | 7-2 | 42.47 | 1,000,000 | 2.05 | 226,826 | 16,133 | 2,144 | 44 | 22,726.27 |
| Whitewater | 3 - AAAAA | 6-3 | 45.55 | 1,000,000 | 1.20 | 17,809 | 5,701 | 800 | 18 | 55,554.56 |
| Banneker | 6 - AAAAA | 7-2 | 44.54 | 1,000,000 | 1.74 | 29,016 | 5,242 | 111 | 10 | 99,999.00 |
| Maynard Jackson | 6 - AAAAA | 7-2 | 43.49 | 1,000,000 | 1.82 | 20,884 | 971 | 53 | 5 | 199,999.00 |
| East Paulding | 7 - AAAAA | 4-5 | 47.56 | 630,814 | 0.66 | 10,309 | 685 | 58 | 4 | 249,999.00 |
| South Effingham | 2 - AAAAA | 1-9 | 34.41 | 1,000,000 | 1.02 | 1,944 | 320 | 22 | 1 | 999,999.00 |
| North Springs | 6 - AAAAA | 5-4 | 31.27 | 729,345 | 0.91 | 15,142 | 332 | 15 | 1 | 999,999.00 |
| Thomas County Central | 1 - AAAAA | 3-6 | 37.30 | 1,000,000 | 1.16 | 4,751 | 375 | 18 | - | - |
| Southwest DeKalb | 5 - AAAAA | 6-3 | 37.30 | 1,000,000 | 1.34 | 6,964 | 658 | 6 | - | - |
| Harris County | 1 - AAAAA | 4-5 | 33.54 | 1,000,000 | 1.10 | 2,486 | 155 | 4 | - | - |
| McIntosh | 3 - AAAAA | 6-3 | 38.96 | 938,186 | 0.96 | 4,644 | 96 | 4 | - | - |
| New Hampstead | 2 - AAAAA | 5-3 | 35.58 | 1,000,000 | 1.14 | 7,664 | 173 | 3 | - | - |
| Paulding County | 7 - AAAAA | 4-5 | 41.55 | 369,186 | 0.38 | 2,680 | 108 | 3 | - | - |
| Cedar Shoals | 8 - AAAAA | 5-4 | 36.10 | 950,634 | 0.97 | 4,206 | 332 | 2 | - | - |
| Columbia | 5 - AAAAA | 5-4 | 28.38 | 934,094 | 1.09 | 1,293 | 44 | - | - | - |
| Decatur | 6 - AAAAA | 4-5 | 25.52 | 270,655 | 0.31 | 2,111 | 26 | - | - | - |
| Lithonia | 5 - AAAAA | 3-6 | 21.10 | 1,000,000 | 1.05 | 1,382 | 24 | - | - | - |
| Fayette County | 3 - AAAAA | 3-6 | 31.88 | 61,814 | 0.06 | 108 | 1 | - | - | - |
| Miller Grove | 5 - AAAAA | 4-5 | 20.45 | 65,906 | 0.07 | 75 | 1 | - | - | - |
| Walnut Grove | 8 - AAAAA | 2-7 | 20.01 | 49,366 | 0.05 | 18 | 1 | - | - | - |
| Ola | 4 - AAAAA | 4-5 | 48.00 | - | - | - | - | - | - | - |
| Woodland (Stockbridge) | 4 - AAAAA | 3-6 | 45.19 | - | - | - | - | - | - | - |
| Villa Rica | 7 - AAAAA | 5-5 | 42.53 | - | - | - | - | - | - | - |
| Locust Grove | 4 - AAAAA | 2-7 | 38.45 | - | - | - | - | - | - | - |
| Hiram | 7 - AAAAA | 3-6 | 37.56 | - | - | - | - | - | - | - |
| Morrow | 3 - AAAAA | 5-5 | 34.93 | - | - | - | - | - | - | - |
| Woodland (Cartersville) | 7 - AAAAA | 3-6 | 34.85 | - | - | - | - | - | - | - |
| Union Grove | 4 - AAAAA | 3-6 | 33.63 | - | - | - | - | - | - | - |
| Statesboro | 2 - AAAAA | 2-6 | 31.26 | - | - | - | - | - | - | - |
| Hampton | 4 - AAAAA | 1-8 | 30.91 | - | - | - | - | - | - | - |
| Loganville | 8 - AAAAA | 1-8 | 29.59 | - | - | - | - | - | - | - |
| Veterans | 1 - AAAAA | 2-8 | 25.36 | - | - | - | - | - | - | - |
| Riverwood | 6 - AAAAA | 2-7 | 24.83 | - | - | - | - | - | - | - |
| Grady | 6 - AAAAA | 2-6 | 22.20 | - | - | - | - | - | - | - |
| Riverdale | 3 - AAAAA | 1-8 | 21.28 | - | - | - | - | - | - | - |
| Cass | 7 - AAAAA | 0-9 | 20.90 | - | - | - | - | - | - | - |
| Lithia Springs | 6 - AAAAA | 1-8 | 17.53 | - | - | - | - | - | - | - |
| Chamblee | 5 - AAAAA | 1-8 | -1.00 | - | - | - | - | - | - | - |
| Johnson (Gainesville) | 8 - AAAAA | 0-9 | -24.54 | - | - | - | - | - | - | - |
| Clarkston | 5 - AAAAA | 1-8 | -26.51 | - | - | - | - | - | - | - |
| Cross Keys | 5 - AAAAA | 0-6 | -65.44 | - | - | - | - | - | - | - |
Playoff Seeding Projections
Each team is shown with its region and the number of times of capturing each seed in the region plus the number of times the team did not make the playoffs.
| Region | Team | 1 | 2 | 3 | 4 | Out |
|---|---|---|---|---|---|---|
| 1 - AAAAA | Warner Robins | 863,062 | 136,938 | - | - | - |
| 1 - AAAAA | Bainbridge | 136,938 | 863,062 | - | - | - |
| 1 - AAAAA | Thomas County Central | - | - | 576,032 | 423,968 | - |
| 1 - AAAAA | Harris County | - | - | 423,968 | 576,032 | - |
| 1 - AAAAA | Veterans | - | - | - | - | 1,000,000 |
| 2 - AAAAA | Wayne County | 1,000,000 | - | - | - | - |
| 2 - AAAAA | Ware County | - | 857,385 | 142,615 | - | - |
| 2 - AAAAA | New Hampstead | - | 142,615 | 857,385 | - | - |
| 2 - AAAAA | South Effingham | - | - | - | 1,000,000 | - |
| 2 - AAAAA | Statesboro | - | - | - | - | 1,000,000 |
| 3 - AAAAA | Starr's Mill | 663,364 | 293,998 | 42,638 | - | - |
| 3 - AAAAA | Griffin | 293,998 | 42,638 | 663,364 | - | - |
| 3 - AAAAA | Whitewater | 42,638 | 663,364 | 293,998 | - | - |
| 3 - AAAAA | McIntosh | - | - | - | 938,186 | 61,814 |
| 3 - AAAAA | Fayette County | - | - | - | 61,814 | 938,186 |
| 3 - AAAAA | Riverdale | - | - | - | - | 1,000,000 |
| 3 - AAAAA | Morrow | - | - | - | - | 1,000,000 |
| 4 - AAAAA | Stockbridge | 1,000,000 | - | - | - | - |
| 4 - AAAAA | Jones County | - | 775,899 | 224,101 | - | - |
| 4 - AAAAA | Dutchtown | - | 224,101 | - | 775,899 | - |
| 4 - AAAAA | Eagle's Landing | - | - | 775,899 | 224,101 | - |
| 4 - AAAAA | Union Grove | - | - | - | - | 1,000,000 |
| 4 - AAAAA | Woodland (Stockbridge) | - | - | - | - | 1,000,000 |
| 4 - AAAAA | Locust Grove | - | - | - | - | 1,000,000 |
| 4 - AAAAA | Ola | - | - | - | - | 1,000,000 |
| 4 - AAAAA | Hampton | - | - | - | - | 1,000,000 |
| 5 - AAAAA | Arabia Mountain | 1,000,000 | - | - | - | - |
| 5 - AAAAA | Southwest DeKalb | - | 716,989 | 283,011 | - | - |
| 5 - AAAAA | Columbia | - | 283,011 | 643,716 | 7,367 | 65,906 |
| 5 - AAAAA | Lithonia | - | - | 73,273 | 926,727 | - |
| 5 - AAAAA | Miller Grove | - | - | - | 65,906 | 934,094 |
| 5 - AAAAA | Chamblee | - | - | - | - | 1,000,000 |
| 5 - AAAAA | Clarkston | - | - | - | - | 1,000,000 |
| 5 - AAAAA | Cross Keys | - | - | - | - | 1,000,000 |
| 6 - AAAAA | Carver (Atlanta) | 1,000,000 | - | - | - | - |
| 6 - AAAAA | Maynard Jackson | - | 1,000,000 | - | - | - |
| 6 - AAAAA | Banneker | - | - | 1,000,000 | - | - |
| 6 - AAAAA | North Springs | - | - | - | 729,345 | 270,655 |
| 6 - AAAAA | Decatur | - | - | - | 270,655 | 729,345 |
| 6 - AAAAA | Riverwood | - | - | - | - | 1,000,000 |
| 6 - AAAAA | Lithia Springs | - | - | - | - | 1,000,000 |
| 6 - AAAAA | Grady | - | - | - | - | 1,000,000 |
| 7 - AAAAA | Rome | 1,000,000 | - | - | - | - |
| 7 - AAAAA | Carrollton | - | 968,416 | 31,584 | - | - |
| 7 - AAAAA | Kell | - | 31,584 | 968,416 | - | - |
| 7 - AAAAA | East Paulding | - | - | - | 630,814 | 369,186 |
| 7 - AAAAA | Paulding County | - | - | - | 369,186 | 630,814 |
| 7 - AAAAA | Villa Rica | - | - | - | - | 1,000,000 |
| 7 - AAAAA | Woodland (Cartersville) | - | - | - | - | 1,000,000 |
| 7 - AAAAA | Hiram | - | - | - | - | 1,000,000 |
| 7 - AAAAA | Cass | - | - | - | - | 1,000,000 |
| 8 - AAAAA | Buford | 964,569 | 35,431 | - | - | - |
| 8 - AAAAA | Flowery Branch | 35,431 | 964,569 | - | - | - |
| 8 - AAAAA | Clarke Central | - | - | 1,000,000 | - | - |
| 8 - AAAAA | Cedar Shoals | - | - | - | 950,634 | 49,366 |
| 8 - AAAAA | Walnut Grove | - | - | - | 49,366 | 950,634 |
| 8 - AAAAA | Loganville | - | - | - | - | 1,000,000 |
| 8 - AAAAA | Johnson (Gainesville) | - | - | - | - | 1,000,000 |
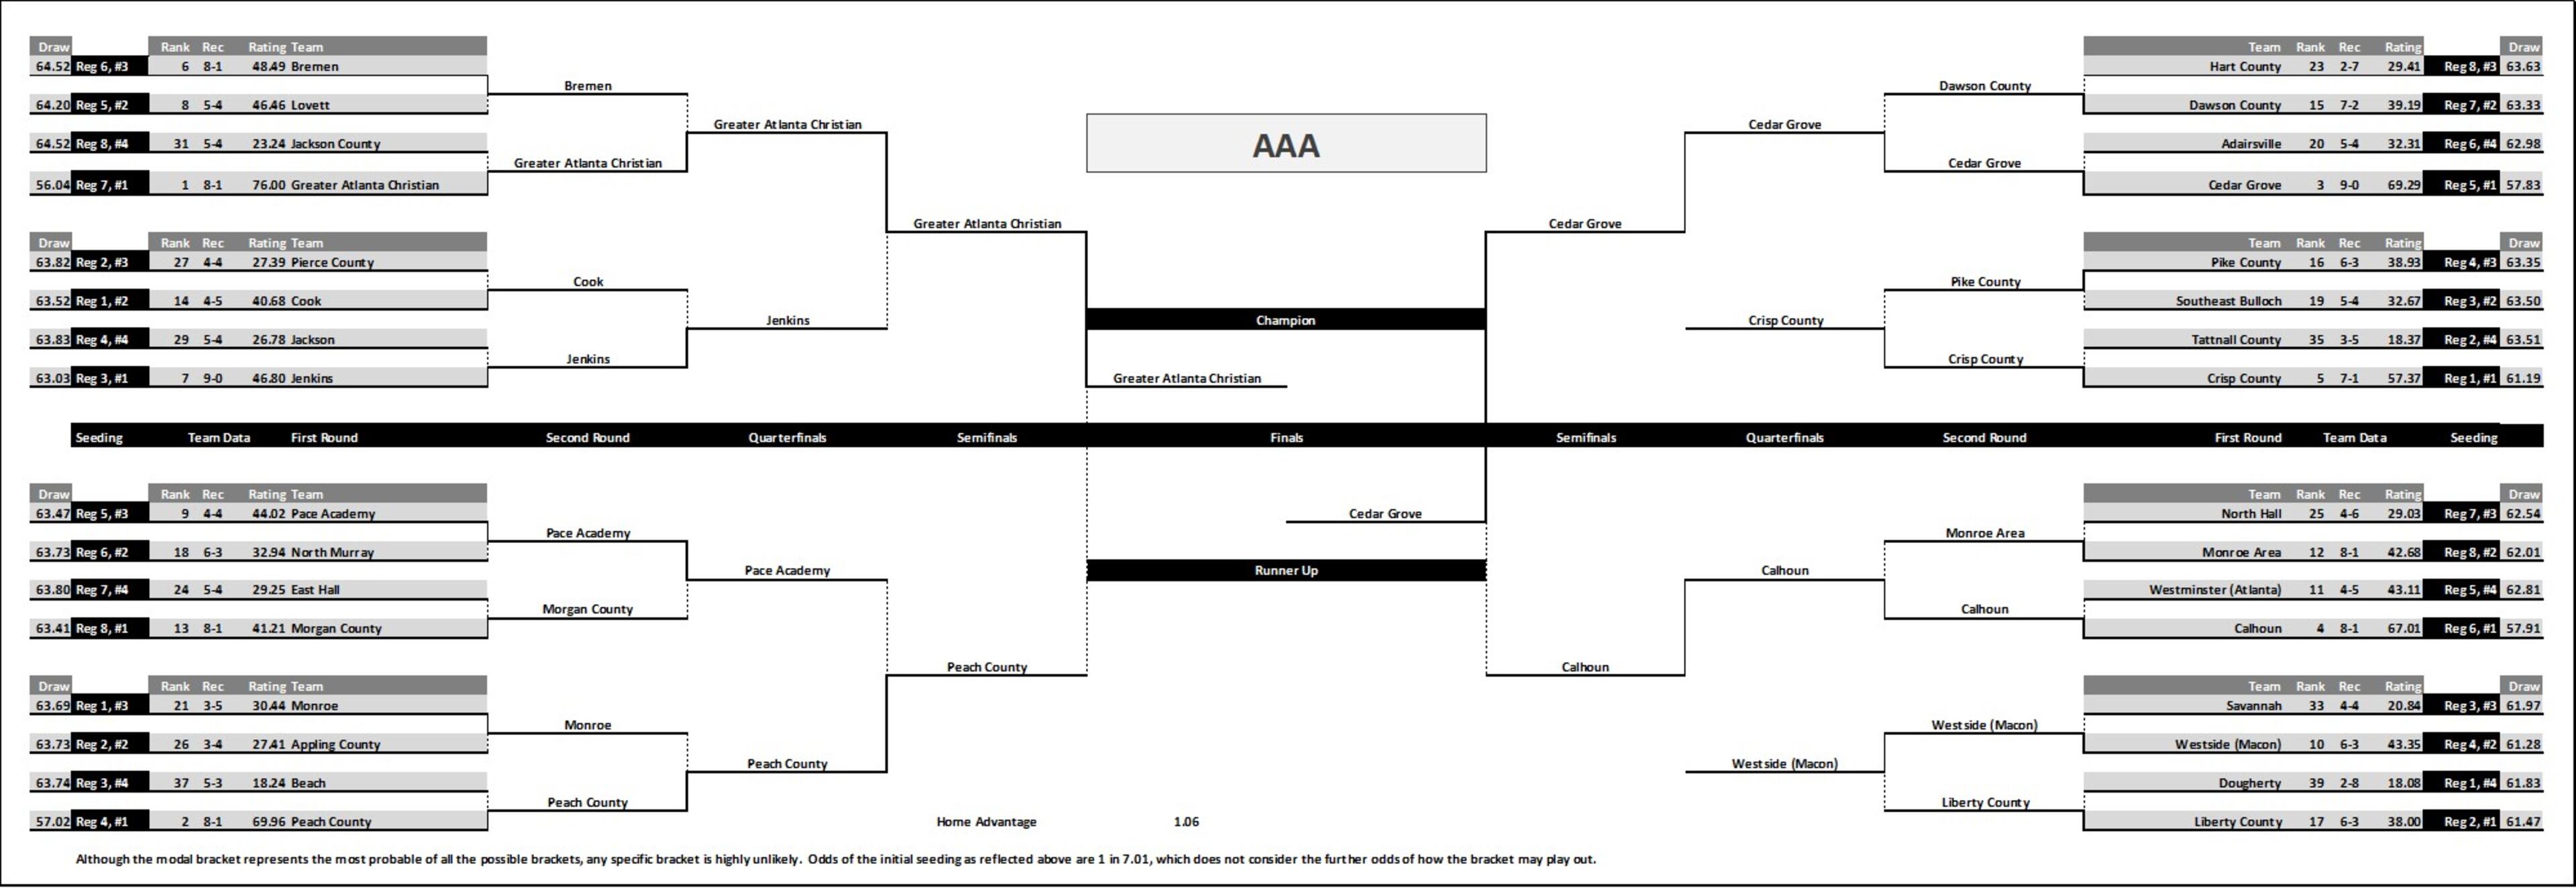
Class AAAA
Modal Bracket
Although any specific bracket is highly unlikely, the modal bracket represents the most probable of all the possible brackets.

Playoff Projections by Region
Each region is shown with the number of times it has teams represented in the semifinals and the finals and the number of times a representative of the region won the state championship along with the associated odds.
| Teams in Semifinals | Teams in Finals | |||||||||
|---|---|---|---|---|---|---|---|---|---|---|
| Region | Eliminated | 1+ | 2+ | 3+ | 4 | Eliminated | 1+ | 2 | Champion | Odds |
| 5 - AAAA | 42,579 | 957,421 | 432,871 | 55,151 | 665 | 121,784 | 878,216 | 189,755 | 810,887 | 0.23 |
| 6 - AAAA | 277,817 | 722,183 | 62,600 | 37 | - | 860,706 | 139,294 | 2,218 | 82,400 | 11.14 |
| 3 - AAAA | 487,260 | 512,740 | 22,930 | 97 | - | 614,215 | 385,785 | 4,764 | 56,001 | 16.86 |
| 7 - AAAA | 629,880 | 370,120 | 16,685 | 178 | 1 | 729,709 | 270,291 | 2,229 | 40,355 | 23.78 |
| 2 - AAAA | 670,242 | 329,758 | 31,715 | 36 | - | 959,527 | 40,473 | 379 | 5,892 | 168.72 |
| 8 - AAAA | 769,783 | 230,217 | 8,769 | 4 | - | 955,092 | 44,908 | 82 | 2,558 | 389.93 |
| 4 - AAAA | 792,942 | 207,058 | 3,068 | - | - | 964,764 | 35,236 | 16 | 1,368 | 729.99 |
| 1 - AAAA | 964,732 | 35,268 | 425 | 2 | - | 993,654 | 6,346 | 8 | 539 | 1,854.29 |
Playoff Projections by Team
Each team is shown with its region, rating, the number of times making it to the finals, and the number of times of winning the state championship along with the associated odds.
| Team | Region | Record | Rating | Playoffs | Avg Depth | Qtrfinals | Semifinals | Finals | Champion | Odds |
|---|---|---|---|---|---|---|---|---|---|---|
| Cartersville | 5 - AAAA | 9-0 | 91.55 | 1,000,000 | 5.51 | 957,438 | 927,382 | 841,860 | 789,396 | 0.27 |
| Ridgeland | 6 - AAAA | 9-0 | 72.08 | 1,000,000 | 3.65 | 827,438 | 694,658 | 122,969 | 81,472 | 11.27 |
| Burke County | 3 - AAAA | 9-0 | 66.81 | 1,000,000 | 3.80 | 899,955 | 488,914 | 376,617 | 50,940 | 18.63 |
| Marist | 7 - AAAA | 9-0 | 67.49 | 1,000,000 | 3.15 | 579,001 | 326,058 | 250,722 | 36,297 | 26.55 |
| Cedartown | 5 - AAAA | 8-1 | 63.53 | 1,000,000 | 2.60 | 399,700 | 204,712 | 119,964 | 12,679 | 77.87 |
| Troup | 5 - AAAA | 8-1 | 60.51 | 1,000,000 | 2.60 | 449,982 | 302,595 | 105,682 | 8,767 | 113.06 |
| Thomson | 3 - AAAA | 7-1 | 60.33 | 1,000,000 | 2.71 | 689,993 | 43,358 | 13,879 | 5,056 | 196.78 |
| Mary Persons | 2 - AAAA | 7-2 | 57.95 | 1,000,000 | 2.96 | 783,688 | 213,202 | 14,730 | 4,807 | 207.03 |
| Blessed Trinity | 7 - AAAA | 7-2 | 61.03 | 1,000,000 | 2.03 | 91,321 | 45,248 | 20,866 | 4,010 | 248.38 |
| St. Pius X | 8 - AAAA | 4-5 | 53.55 | 1,000,000 | 2.37 | 326,527 | 193,769 | 42,784 | 2,015 | 495.28 |
| Woodward Academy | 4 - AAAA | 9-1 | 50.80 | 1,000,000 | 2.70 | 528,413 | 194,369 | 34,857 | 1,319 | 757.15 |
| West Laurens | 2 - AAAA | 5-4 | 51.80 | 1,000,000 | 2.31 | 389,975 | 147,120 | 25,943 | 1,083 | 922.36 |
| Heritage (Ringgold) | 6 - AAAA | 8-1 | 53.52 | 1,000,000 | 1.60 | 161,758 | 88,912 | 18,443 | 925 | 1,080.08 |
| Jefferson | 8 - AAAA | 7-2 | 54.02 | 1,000,000 | 1.78 | 97,279 | 43,866 | 2,136 | 543 | 1,840.62 |
| Americus-Sumter | 1 - AAAA | 7-2 | 52.21 | 1,000,000 | 2.14 | 288,923 | 10,047 | 2,031 | 432 | 2,313.81 |
| Cairo | 1 - AAAA | 6-3 | 46.71 | 1,000,000 | 1.81 | 81,593 | 10,676 | 3,133 | 86 | 11,626.91 |
| Eastside | 4 - AAAA | 7-2 | 45.30 | 1,000,000 | 1.81 | 151,887 | 15,714 | 393 | 49 | 20,407.16 |
| White County | 7 - AAAA | 7-2 | 46.13 | 1,000,000 | 1.40 | 35,540 | 10,457 | 593 | 45 | 22,221.22 |
| Chapel Hill | 5 - AAAA | 6-3 | 48.09 | 1,000,000 | 1.13 | 34,556 | 11,421 | 465 | 45 | 22,221.22 |
| Northside (Columbus) | 1 - AAAA | 7-2 | 42.38 | 1,000,000 | 1.34 | 76,582 | 14,497 | 1,188 | 21 | 47,618.05 |
| Baldwin | 3 - AAAA | 5-4 | 39.03 | 1,000,000 | 1.41 | 52,695 | 3,396 | 50 | 5 | 199,999.00 |
| West Hall | 7 - AAAA | 5-4 | 39.97 | 1,000,000 | 1.22 | 22,186 | 5,220 | 339 | 3 | 333,332.33 |
| Spalding | 2 - AAAA | 3-5 | 39.92 | 616,960 | 0.82 | 12,063 | 786 | 136 | 2 | 499,999.00 |
| Pickens | 6 - AAAA | 5-4 | 38.42 | 983,793 | 1.07 | 7,730 | 1,139 | 97 | 2 | 499,999.00 |
| Northwest Whitfield | 6 - AAAA | 6-4 | 39.75 | 839,123 | 0.84 | 661 | 104 | 3 | 1 | 999,999.00 |
| Stephens County | 8 - AAAA | 4-5 | 38.72 | 613,795 | 0.65 | 3,164 | 260 | 47 | - | - |
| Upson-Lee | 2 - AAAA | 4-5 | 37.06 | 393,541 | 0.49 | 5,317 | 225 | 36 | - | - |
| Oconee County | 8 - AAAA | 5-4 | 40.86 | 945,835 | 1.11 | 5,267 | 1,079 | 23 | - | - |
| Howard | 2 - AAAA | 6-3 | 37.56 | 989,499 | 1.18 | 17,220 | 176 | 7 | - | - |
| Richmond Academy | 3 - AAAA | 5-4 | 23.14 | 1,000,000 | 1.06 | 3,513 | 100 | 3 | - | - |
| Hardaway | 1 - AAAA | 3-6 | 36.40 | 63,951 | 0.07 | 1,857 | 100 | 2 | - | - |
| Salem | 4 - AAAA | 5-4 | 27.99 | 979,545 | 1.01 | 3,415 | 31 | 2 | - | - |
| Carver (Columbus) | 1 - AAAA | 3-6 | 31.28 | 928,426 | 0.99 | 11,638 | 375 | - | - | - |
| Madison County | 8 - AAAA | 4-5 | 29.60 | 440,370 | 0.45 | 384 | 15 | - | - | - |
| North Clayton | 4 - AAAA | 4-5 | 21.25 | 1,000,000 | 1.02 | 1,238 | 12 | - | - | - |
| Southeast Whitfield | 6 - AAAA | 7-2 | 32.19 | 177,084 | 0.18 | 68 | 7 | - | - | - |
| Columbus | 1 - AAAA | 3-6 | 25.72 | 7,623 | 0.01 | 29 | - | - | - | - |
| Henry County | 4 - AAAA | 2-7 | 15.26 | 20,455 | 0.02 | 6 | - | - | - | - |
| Sandy Creek | 5 - AAAA | 4-5 | 48.02 | - | - | - | - | - | - | - |
| Perry | 2 - AAAA | 4-5 | 33.20 | - | - | - | - | - | - | - |
| Central (Carrollton) | 5 - AAAA | 3-6 | 32.41 | - | - | - | - | - | - | - |
| Chestatee | 7 - AAAA | 4-6 | 29.77 | - | - | - | - | - | - | - |
| Westover | 1 - AAAA | 4-5 | 27.24 | - | - | - | - | - | - | - |
| North Oconee | 8 - AAAA | 1-8 | 26.72 | - | - | - | - | - | - | - |
| LaGrange | 5 - AAAA | 0-10 | 18.65 | - | - | - | - | - | - | - |
| Hephzibah | 3 - AAAA | 4-5 | 15.15 | - | - | - | - | - | - | - |
| Shaw | 1 - AAAA | 1-8 | 13.48 | - | - | - | - | - | - | - |
| Luella | 4 - AAAA | 1-8 | 10.22 | - | - | - | - | - | - | - |
| LaFayette | 6 - AAAA | 2-7 | 5.14 | - | - | - | - | - | - | - |
| Cross Creek | 3 - AAAA | 2-7 | 2.81 | - | - | - | - | - | - | - |
| Druid Hills | 4 - AAAA | 1-8 | -5.06 | - | - | - | - | - | - | - |
| Gilmer | 6 - AAAA | 0-9 | -19.09 | - | - | - | - | - | - | - |
Playoff Seeding Projections
Each team is shown with its region and the number of times of capturing each seed in the region plus the number of times the team did not make the playoffs.
| Region | Team | 1 | 2 | 3 | 4 | Out |
|---|---|---|---|---|---|---|
| 1 - AAAA | Americus-Sumter | 1,000,000 | - | - | - | - |
| 1 - AAAA | Cairo | - | 1,000,000 | - | - | - |
| 1 - AAAA | Northside (Columbus) | - | - | 1,000,000 | - | - |
| 1 - AAAA | Carver (Columbus) | - | - | - | 928,426 | 71,574 |
| 1 - AAAA | Hardaway | - | - | - | 63,951 | 936,049 |
| 1 - AAAA | Columbus | - | - | - | 7,623 | 992,377 |
| 1 - AAAA | Shaw | - | - | - | - | 1,000,000 |
| 1 - AAAA | Westover | - | - | - | - | 1,000,000 |
| 2 - AAAA | Mary Persons | 1,000,000 | - | - | - | - |
| 2 - AAAA | West Laurens | - | 1,000,000 | - | - | - |
| 2 - AAAA | Spalding | - | - | 606,459 | 10,501 | 383,040 |
| 2 - AAAA | Upson-Lee | - | - | 345,639 | 47,902 | 606,459 |
| 2 - AAAA | Howard | - | - | 47,902 | 941,597 | 10,501 |
| 2 - AAAA | Perry | - | - | - | - | 1,000,000 |
| 3 - AAAA | Burke County | 1,000,000 | - | - | - | - |
| 3 - AAAA | Thomson | - | 991,309 | 6,839 | 1,852 | - |
| 3 - AAAA | Richmond Academy | - | 8,691 | 11,778 | 979,531 | - |
| 3 - AAAA | Baldwin | - | - | 981,383 | 18,617 | - |
| 3 - AAAA | Hephzibah | - | - | - | - | 1,000,000 |
| 3 - AAAA | Cross Creek | - | - | - | - | 1,000,000 |
| 4 - AAAA | Woodward Academy | 1,000,000 | - | - | - | - |
| 4 - AAAA | Eastside | - | 927,562 | 72,438 | - | - |
| 4 - AAAA | North Clayton | - | 72,438 | 317,764 | 609,798 | - |
| 4 - AAAA | Salem | - | - | 590,772 | 388,773 | 20,455 |
| 4 - AAAA | Henry County | - | - | 19,026 | 1,429 | 979,545 |
| 4 - AAAA | Luella | - | - | - | - | 1,000,000 |
| 4 - AAAA | Druid Hills | - | - | - | - | 1,000,000 |
| 5 - AAAA | Cartersville | 986,323 | 13,641 | 36 | - | - |
| 5 - AAAA | Troup | 13,677 | 180,071 | 806,252 | - | - |
| 5 - AAAA | Cedartown | - | 806,253 | 161,287 | 32,460 | - |
| 5 - AAAA | Chapel Hill | - | 35 | 32,425 | 967,540 | - |
| 5 - AAAA | Sandy Creek | - | - | - | - | 1,000,000 |
| 5 - AAAA | Central (Carrollton) | - | - | - | - | 1,000,000 |
| 5 - AAAA | LaGrange | - | - | - | - | 1,000,000 |
| 6 - AAAA | Ridgeland | 1,000,000 | - | - | - | - |
| 6 - AAAA | Heritage (Ringgold) | - | 839,123 | 160,877 | - | - |
| 6 - AAAA | Pickens | - | 160,877 | 822,916 | - | 16,207 |
| 6 - AAAA | Southeast Whitfield | - | - | 16,207 | 160,877 | 822,916 |
| 6 - AAAA | Northwest Whitfield | - | - | - | 839,123 | 160,877 |
| 6 - AAAA | Gilmer | - | - | - | - | 1,000,000 |
| 6 - AAAA | LaFayette | - | - | - | - | 1,000,000 |
| 7 - AAAA | Marist | 887,812 | 94,615 | 17,573 | - | - |
| 7 - AAAA | Blessed Trinity | 99,189 | 872,636 | 15,123 | 13,052 | - |
| 7 - AAAA | White County | 12,999 | 17,565 | 867,587 | 101,849 | - |
| 7 - AAAA | West Hall | - | 15,184 | 99,717 | 885,099 | - |
| 7 - AAAA | Chestatee | - | - | - | - | 1,000,000 |
| 8 - AAAA | St. Pius X | 1,000,000 | - | - | - | - |
| 8 - AAAA | Jefferson | - | 811,446 | 188,554 | - | - |
| 8 - AAAA | Oconee County | - | 188,554 | 739,764 | 17,517 | 54,165 |
| 8 - AAAA | Madison County | - | - | 71,682 | 368,688 | 559,630 |
| 8 - AAAA | Stephens County | - | - | - | 613,795 | 386,205 |
| 8 - AAAA | North Oconee | - | - | - | - | 1,000,000 |
Class AAA
Modal Bracket
Although any specific bracket is highly unlikely, the modal bracket represents the most probable of all the possible brackets.
Playoff Projections by Region
Each region is shown with the number of times it has teams represented in the semifinals and the finals and the number of times a representative of the region won the state championship along with the associated odds.
| Teams in Semifinals | Teams in Finals | |||||||||
|---|---|---|---|---|---|---|---|---|---|---|
| Region | Eliminated | 1+ | 2+ | 3+ | 4 | Eliminated | 1+ | 2 | Champion | Odds |
| 7 - AAA | 100,164 | 899,836 | 19,205 | 44 | - | 380,675 | 619,325 | 641 | 441,014 | 1.27 |
| 4 - AAA | 74,349 | 925,651 | 81,885 | 449 | - | 622,731 | 377,269 | 3,213 | 213,262 | 3.69 |
| 5 - AAA | 238,170 | 761,830 | 51,667 | 1,153 | 8 | 513,091 | 486,909 | 2,019 | 190,668 | 4.24 |
| 6 - AAA | 182,355 | 817,645 | 24,048 | 67 | - | 595,611 | 404,389 | 1,220 | 138,570 | 6.22 |
| 1 - AAA | 757,604 | 242,396 | 4,147 | 10 | - | 910,935 | 89,065 | 105 | 15,176 | 64.89 |
| 3 - AAA | 941,265 | 58,735 | 136 | - | - | 992,534 | 7,466 | 2 | 875 | 1,141.86 |
| 8 - AAA | 927,514 | 72,486 | 1,259 | 1 | - | 993,983 | 6,017 | 9 | 355 | 2,815.90 |
| 2 - AAA | 962,759 | 37,241 | 93 | - | - | 997,649 | 2,351 | - | 80 | 12,499.00 |
Playoff Projections by Team
Each team is shown with its region, rating, the number of times making it to the finals, and the number of times of winning the state championship along with the associated odds.
| Team | Region | Record | Rating | Playoffs | Avg Depth | Qtrfinals | Semifinals | Finals | Champion | Odds |
|---|---|---|---|---|---|---|---|---|---|---|
| Greater Atlanta Christian | 7 - AAA | 8-1 | 76.00 | 1,000,000 | 4.91 | 946,003 | 907,086 | 618,857 | 440,962 | 1.27 |
| Peach County | 4 - AAA | 8-1 | 69.96 | 1,000,000 | 4.47 | 973,494 | 918,384 | 371,775 | 212,806 | 3.70 |
| Cedar Grove | 5 - AAA | 9-0 | 69.29 | 1,000,000 | 4.33 | 933,738 | 744,139 | 482,232 | 190,046 | 4.26 |
| Calhoun | 6 - AAA | 8-1 | 67.01 | 995,945 | 4.15 | 869,188 | 811,664 | 402,430 | 138,134 | 6.24 |
| Crisp County | 1 - AAA | 7-1 | 57.37 | 1,000,000 | 3.19 | 878,715 | 228,548 | 87,987 | 15,099 | 65.23 |
| Jenkins | 3 - AAA | 9-0 | 46.80 | 1,000,000 | 2.64 | 675,259 | 56,395 | 7,356 | 871 | 1,147.11 |
| Bremen | 6 - AAA | 8-1 | 48.49 | 862,886 | 1.51 | 142,404 | 26,134 | 3,028 | 432 | 2,313.81 |
| Westside (Macon) | 4 - AAA | 6-3 | 43.35 | 1,000,000 | 2.58 | 597,993 | 83,201 | 8,037 | 426 | 2,346.42 |
| Lovett | 5 - AAA | 5-4 | 46.46 | 1,000,000 | 1.68 | 40,932 | 20,601 | 2,527 | 292 | 3,423.66 |
| Pace Academy | 5 - AAA | 4-4 | 44.02 | 899,138 | 1.87 | 354,147 | 27,913 | 2,128 | 227 | 4,404.29 |
| Monroe Area | 8 - AAA | 8-1 | 42.68 | 1,000,000 | 1.96 | 87,137 | 47,371 | 4,279 | 215 | 4,650.16 |
| Morgan County | 8 - AAA | 8-1 | 41.21 | 1,000,000 | 2.20 | 375,719 | 25,817 | 1,717 | 140 | 7,141.86 |
| Westminster (Atlanta) | 5 - AAA | 4-5 | 43.11 | 1,000,000 | 1.24 | 73,393 | 21,974 | 2,041 | 103 | 9,707.74 |
| Liberty County | 2 - AAA | 6-3 | 38.00 | 1,000,000 | 2.24 | 340,150 | 34,933 | 2,290 | 80 | 12,499.00 |
| Cook | 1 - AAA | 4-5 | 40.68 | 1,000,000 | 2.07 | 243,658 | 15,376 | 1,122 | 75 | 13,332.33 |
| Dawson County | 7 - AAA | 7-2 | 39.19 | 1,000,000 | 1.81 | 45,875 | 9,617 | 1,049 | 50 | 19,999.00 |
| Pike County | 4 - AAA | 6-3 | 38.93 | 1,000,000 | 1.78 | 92,677 | 6,006 | 655 | 30 | 33,332.33 |
| Southeast Bulloch | 3 - AAA | 5-4 | 32.67 | 1,000,000 | 1.38 | 43,845 | 2,074 | 109 | 4 | 249,999.00 |
| North Murray | 6 - AAA | 6-3 | 32.94 | 669,704 | 0.91 | 66,601 | 2,645 | 86 | 2 | 499,999.00 |
| Monroe | 1 - AAA | 3-5 | 30.44 | 1,000,000 | 1.60 | 37,377 | 2,458 | 61 | 2 | 499,999.00 |
| Adairsville | 6 - AAA | 5-4 | 32.31 | 790,123 | 0.87 | 6,882 | 1,022 | 57 | 2 | 499,999.00 |
| North Hall | 7 - AAA | 4-6 | 29.03 | 1,000,000 | 1.19 | 6,102 | 1,423 | 40 | 1 | 999,999.00 |
| East Hall | 7 - AAA | 5-4 | 29.25 | 1,000,000 | 1.25 | 40,846 | 959 | 20 | 1 | 999,999.00 |
| Pierce County | 2 - AAA | 4-4 | 27.39 | 1,000,000 | 1.38 | 44,865 | 1,512 | 40 | - | - |
| Hart County | 8 - AAA | 2-7 | 29.41 | 1,000,000 | 1.25 | 5,762 | 476 | 26 | - | - |
| Appling County | 2 - AAA | 3-4 | 27.41 | 1,000,000 | 1.30 | 14,043 | 860 | 21 | - | - |
| Jackson | 4 - AAA | 5-4 | 26.78 | 1,000,000 | 1.13 | 27,962 | 397 | 15 | - | - |
| Ringgold | 6 - AAA | 5-4 | 29.44 | 137,114 | 0.16 | 2,614 | 162 | 4 | - | - |
| Sonoraville | 6 - AAA | 4-5 | 27.34 | 330,296 | 0.34 | 1,511 | 124 | 4 | - | - |
| Jackson County | 8 - AAA | 5-4 | 23.24 | 1,000,000 | 1.01 | 701 | 82 | 4 | - | - |
| Savannah | 3 - AAA | 4-4 | 20.84 | 937,350 | 1.01 | 12,995 | 325 | 2 | - | - |
| Beach | 3 - AAA | 5-3 | 18.24 | 796,044 | 0.80 | 1,291 | 60 | 1 | - | - |
| Dougherty | 1 - AAA | 2-8 | 18.08 | 1,000,000 | 1.14 | 11,360 | 170 | - | - | - |
| Towers | 5 - AAA | 4-5 | 23.75 | 100,862 | 0.10 | 192 | 34 | - | - | - |
| Tattnall County | 2 - AAA | 3-5 | 18.37 | 1,000,000 | 1.04 | 3,060 | 30 | - | - | - |
| Windsor Forest | 3 - AAA | 7-2 | 21.31 | 266,606 | 0.30 | 1,256 | 18 | - | - | - |
| Lakeview-Ft. Oglethorpe | 6 - AAA | 5-4 | 18.42 | 209,877 | 0.22 | 253 | 10 | - | - | - |
| Murray County | 6 - AAA | 3-6 | 11.42 | 4,055 | 0.00 | - | - | - | - | - |
| Union County | 7 - AAA | 5-4 | 18.34 | - | - | - | - | - | - | - |
| Central (Macon) | 4 - AAA | 2-7 | 18.23 | - | - | - | - | - | - | - |
| Redan | 5 - AAA | 3-6 | 16.99 | - | - | - | - | - | - | - |
| Franklin County | 8 - AAA | 2-7 | 15.64 | - | - | - | - | - | - | - |
| Lumpkin County | 7 - AAA | 1-8 | 8.36 | - | - | - | - | - | - | - |
| Kendrick | 4 - AAA | 1-8 | 5.95 | - | - | - | - | - | - | - |
| McNair | 5 - AAA | 3-6 | 5.85 | - | - | - | - | - | - | - |
| Islands | 3 - AAA | 2-7 | 5.47 | - | - | - | - | - | - | - |
| Haralson County | 6 - AAA | 1-8 | 4.95 | - | - | - | - | - | - | - |
| Worth County | 1 - AAA | 0-9 | 4.30 | - | - | - | - | - | - | - |
| Rutland | 4 - AAA | 0-8 | 2.94 | - | - | - | - | - | - | - |
| Brantley County | 2 - AAA | 0-8 | 2.74 | - | - | - | - | - | - | - |
| Long County | 2 - AAA | 0-9 | 2.12 | - | - | - | - | - | - | - |
| Fannin County | 7 - AAA | 2-7 | 1.28 | - | - | - | - | - | - | - |
| Stone Mountain | 5 - AAA | 1-8 | -7.63 | - | - | - | - | - | - | - |
| East Jackson | 8 - AAA | 1-7 | -11.06 | - | - | - | - | - | - | - |
| Coahulla Creek | 6 - AAA | 0-9 | -13.14 | - | - | - | - | - | - | - |
| Groves | 3 - AAA | 1-8 | -19.76 | - | - | - | - | - | - | - |
| Johnson (Savannah) | 3 - AAA | 0-9 | -23.77 | - | - | - | - | - | - | - |
Playoff Seeding Projections
Each team is shown with its region and the number of times of capturing each seed in the region plus the number of times the team did not make the playoffs.
| Region | Team | 1 | 2 | 3 | 4 | Out |
|---|---|---|---|---|---|---|
| 1 - AAA | Crisp County | 1,000,000 | - | - | - | - |
| 1 - AAA | Cook | - | 763,835 | 236,165 | - | - |
| 1 - AAA | Monroe | - | 236,165 | 763,835 | - | - |
| 1 - AAA | Dougherty | - | - | - | 1,000,000 | - |
| 1 - AAA | Worth County | - | - | - | - | 1,000,000 |
| 2 - AAA | Liberty County | 873,047 | 122,608 | 4,345 | - | - |
| 2 - AAA | Pierce County | 126,953 | 252,589 | 620,458 | - | - |
| 2 - AAA | Appling County | - | 574,588 | 231,686 | 193,726 | - |
| 2 - AAA | Tattnall County | - | 50,215 | 143,511 | 806,274 | - |
| 2 - AAA | Brantley County | - | - | - | - | 1,000,000 |
| 2 - AAA | Long County | - | - | - | - | 1,000,000 |
| 3 - AAA | Jenkins | 1,000,000 | - | - | - | - |
| 3 - AAA | Southeast Bulloch | - | 789,432 | 209,639 | 929 | - |
| 3 - AAA | Windsor Forest | - | 210,568 | 6,854 | 49,184 | 733,394 |
| 3 - AAA | Savannah | - | - | 733,394 | 203,956 | 62,650 |
| 3 - AAA | Beach | - | - | 50,113 | 745,931 | 203,956 |
| 3 - AAA | Islands | - | - | - | - | 1,000,000 |
| 3 - AAA | Johnson (Savannah) | - | - | - | - | 1,000,000 |
| 3 - AAA | Groves | - | - | - | - | 1,000,000 |
| 4 - AAA | Peach County | 1,000,000 | - | - | - | - |
| 4 - AAA | Westside (Macon) | - | 1,000,000 | - | - | - |
| 4 - AAA | Pike County | - | - | 999,669 | 331 | - |
| 4 - AAA | Jackson | - | - | 331 | 999,669 | - |
| 4 - AAA | Kendrick | - | - | - | - | 1,000,000 |
| 4 - AAA | Central (Macon) | - | - | - | - | 1,000,000 |
| 4 - AAA | Rutland | - | - | - | - | 1,000,000 |
| 5 - AAA | Cedar Grove | 1,000,000 | - | - | - | - |
| 5 - AAA | Lovett | - | 980,564 | 6,284 | 13,152 | - |
| 5 - AAA | Westminster (Atlanta) | - | 14,647 | 100,615 | 884,738 | - |
| 5 - AAA | Pace Academy | - | 4,789 | 893,099 | 1,250 | 100,862 |
| 5 - AAA | Towers | - | - | 2 | 100,860 | 899,138 |
| 5 - AAA | Redan | - | - | - | - | 1,000,000 |
| 5 - AAA | McNair | - | - | - | - | 1,000,000 |
| 5 - AAA | Stone Mountain | - | - | - | - | 1,000,000 |
| 6 - AAA | Calhoun | 995,945 | - | - | - | 4,055 |
| 6 - AAA | North Murray | 2,700 | 667,004 | - | - | 330,296 |
| 6 - AAA | Bremen | 1,158 | 286,299 | 575,429 | - | 137,114 |
| 6 - AAA | Ringgold | 158 | 35,685 | 82,047 | 19,224 | 862,886 |
| 6 - AAA | Lakeview-Ft. Oglethorpe | 39 | 9,925 | 79,105 | 120,808 | 790,123 |
| 6 - AAA | Adairsville | - | 1,087 | 262,064 | 526,972 | 209,877 |
| 6 - AAA | Sonoraville | - | - | 1,353 | 328,943 | 669,704 |
| 6 - AAA | Murray County | - | - | 2 | 4,053 | 995,945 |
| 6 - AAA | Haralson County | - | - | - | - | 1,000,000 |
| 6 - AAA | Coahulla Creek | - | - | - | - | 1,000,000 |
| 7 - AAA | Greater Atlanta Christian | 978,882 | 21,118 | - | - | - |
| 7 - AAA | Dawson County | 21,118 | 978,882 | - | - | - |
| 7 - AAA | North Hall | - | - | 1,000,000 | - | - |
| 7 - AAA | East Hall | - | - | - | 1,000,000 | - |
| 7 - AAA | Lumpkin County | - | - | - | - | 1,000,000 |
| 7 - AAA | Union County | - | - | - | - | 1,000,000 |
| 7 - AAA | Fannin County | - | - | - | - | 1,000,000 |
| 8 - AAA | Morgan County | 1,000,000 | - | - | - | - |
| 8 - AAA | Monroe Area | - | 1,000,000 | - | - | - |
| 8 - AAA | Hart County | - | - | 997,819 | 2,181 | - |
| 8 - AAA | Jackson County | - | - | 2,181 | 997,819 | - |
| 8 - AAA | Franklin County | - | - | - | - | 1,000,000 |
| 8 - AAA | East Jackson | - | - | - | - | 1,000,000 |
Class AA
Modal Bracket
Although any specific bracket is highly unlikely, the modal bracket represents the most probable of all the possible brackets.

Playoff Projections by Region
Each region is shown with the number of times it has teams represented in the semifinals and the finals and the number of times a representative of the region won the state championship along with the associated odds.
| Teams in Semifinals | Teams in Finals | |||||||||
|---|---|---|---|---|---|---|---|---|---|---|
| Region | Eliminated | 1+ | 2+ | 3+ | 4 | Eliminated | 1+ | 2 | Champion | Odds |
| 2 - AA | 254,375 | 745,625 | 85,690 | 1,300 | 4 | 429,703 | 570,297 | 23,953 | 445,274 | 1.25 |
| 1 - AA | 156,363 | 843,637 | 316,484 | 6,987 | 1 | 585,514 | 414,486 | 52,642 | 223,311 | 3.48 |
| 8 - AA | 224,299 | 775,701 | 628 | - | - | 465,587 | 534,413 | 18 | 192,103 | 4.21 |
| 6 - AA | 720,465 | 279,535 | 936 | - | - | 847,016 | 152,984 | 30 | 89,492 | 10.17 |
| 3 - AA | 675,839 | 324,161 | 4,060 | 7 | - | 877,752 | 122,248 | 49 | 26,095 | 37.32 |
| 5 - AA | 672,319 | 327,681 | 27,559 | 25 | - | 937,495 | 62,505 | 949 | 15,749 | 62.50 |
| 4 - AA | 906,738 | 93,262 | 858 | - | - | 968,734 | 31,266 | 50 | 4,234 | 235.18 |
| 7 - AA | 837,188 | 162,812 | 3,040 | 5 | - | 965,918 | 34,082 | 28 | 3,742 | 266.24 |
Playoff Projections by Team
Each team is shown with its region, rating, the number of times making it to the finals, and the number of times of winning the state championship along with the associated odds.
| Team | Region | Record | Rating | Playoffs | Avg Depth | Qtrfinals | Semifinals | Finals | Champion | Odds |
|---|---|---|---|---|---|---|---|---|---|---|
| Benedictine | 2 - AA | 9-0 | 77.06 | 1,000,000 | 4.63 | 939,884 | 710,935 | 550,250 | 438,191 | 1.28 |
| Rabun County | 8 - AA | 9-0 | 66.44 | 1,000,000 | 4.44 | 959,543 | 775,518 | 534,387 | 192,101 | 4.21 |
| Thomasville | 1 - AA | 9-0 | 68.17 | 1,000,000 | 3.98 | 890,020 | 711,957 | 271,742 | 163,103 | 5.13 |
| Hapeville Charter | 6 - AA | 8-1 | 66.72 | 1,000,000 | 3.45 | 948,317 | 277,084 | 152,841 | 89,490 | 10.17 |
| Brooks County | 1 - AA | 7-1 | 63.61 | 1,000,000 | 3.10 | 558,872 | 431,320 | 189,752 | 59,678 | 15.76 |
| Dodge County | 3 - AA | 9-0 | 58.81 | 1,000,000 | 2.89 | 443,485 | 315,368 | 121,722 | 26,046 | 37.39 |
| Heard County | 5 - AA | 8-1 | 56.52 | 1,000,000 | 3.07 | 815,971 | 241,247 | 37,916 | 12,745 | 77.46 |
| Toombs County | 2 - AA | 8-1 | 55.24 | 1,000,000 | 2.26 | 424,754 | 105,047 | 42,048 | 6,920 | 143.51 |
| Rockmart | 7 - AA | 7-2 | 50.49 | 1,000,000 | 2.72 | 547,517 | 145,159 | 33,107 | 3,630 | 274.48 |
| Screven County | 4 - AA | 8-0 | 52.70 | 1,000,000 | 2.21 | 285,192 | 64,126 | 22,846 | 3,236 | 308.02 |
| Callaway | 5 - AA | 8-1 | 51.36 | 1,000,000 | 2.44 | 432,493 | 113,028 | 25,486 | 3,004 | 331.89 |
| Jefferson County | 4 - AA | 9-0 | 49.78 | 1,000,000 | 1.99 | 165,420 | 29,824 | 8,470 | 998 | 1,001.00 |
| Fitzgerald | 1 - AA | 4-5 | 48.67 | 1,000,000 | 1.49 | 142,706 | 23,780 | 5,631 | 530 | 1,885.79 |
| Vidalia | 2 - AA | 4-4 | 46.82 | 1,000,000 | 1.19 | 31,010 | 11,594 | 1,795 | 153 | 6,534.95 |
| Pepperell | 7 - AA | 6-3 | 42.47 | 1,000,000 | 2.04 | 172,363 | 19,801 | 976 | 111 | 9,008.01 |
| Washington County | 3 - AA | 4-5 | 41.41 | 1,000,000 | 1.47 | 37,866 | 6,252 | 363 | 34 | 29,410.76 |
| Bleckley County | 3 - AA | 6-3 | 39.00 | 673,546 | 1.09 | 25,821 | 4,492 | 137 | 12 | 83,332.33 |
| Jeff Davis | 2 - AA | 5-3 | 38.68 | 830,157 | 0.89 | 20,825 | 3,712 | 97 | 7 | 142,856.14 |
| Swainsboro | 2 - AA | 6-3 | 41.05 | 169,843 | 0.19 | 5,987 | 1,331 | 60 | 3 | 333,332.33 |
| Dublin | 3 - AA | 5-4 | 33.75 | 1,000,000 | 1.36 | 17,790 | 1,767 | 46 | 3 | 333,332.33 |
| Elbert County | 8 - AA | 7-2 | 34.75 | 1,000,000 | 1.56 | 27,120 | 806 | 44 | 2 | 499,999.00 |
| B.E.S.T. Academy | 6 - AA | 5-5 | 30.34 | 1,000,000 | 1.62 | 19,519 | 1,928 | 109 | 1 | 999,999.00 |
| Douglass | 6 - AA | 6-3 | 34.02 | 1,000,000 | 1.15 | 19,868 | 1,164 | 59 | 1 | 999,999.00 |
| Coosa | 7 - AA | 6-3 | 33.52 | 1,000,000 | 1.47 | 19,789 | 515 | 23 | 1 | 999,999.00 |
| Spencer | 5 - AA | 5-4 | 31.35 | 1,000,000 | 1.21 | 12,389 | 729 | 45 | - | - |
| Southwest | 3 - AA | 4-4 | 35.38 | 326,454 | 0.38 | 5,783 | 349 | 29 | - | - |
| Temple | 5 - AA | 5-4 | 25.18 | 685,416 | 0.91 | 4,843 | 258 | 7 | - | - |
| South Atlanta | 6 - AA | 5-5 | 26.44 | 1,000,000 | 1.05 | 9,070 | 296 | 5 | - | - |
| Chattooga | 7 - AA | 4-5 | 24.95 | 1,000,000 | 1.13 | 9,690 | 383 | 4 | - | - |
| Berrien | 1 - AA | 4-5 | 30.08 | 1,000,000 | 1.01 | 1,104 | 52 | 3 | - | - |
| Harlem | 4 - AA | 6-3 | 23.34 | 1,000,000 | 1.17 | 3,224 | 162 | - | - | - |
| Glenn Hills | 4 - AA | 5-4 | 19.41 | 908,694 | 0.92 | 254 | 8 | - | - | - |
| Banks County | 8 - AA | 5-4 | 12.03 | 1,000,000 | 1.07 | 1,028 | 4 | - | - | - |
| Lamar County | 5 - AA | 1-8 | 18.74 | 312,538 | 0.32 | 350 | 2 | - | - | - |
| Putnam County | 8 - AA | 5-4 | 6.06 | 827,574 | 0.84 | 118 | 1 | - | - | - |
| Jordan | 5 - AA | 2-7 | 22.33 | 2,046 | 0.00 | 8 | 1 | - | - | - |
| Butler | 4 - AA | 3-6 | 7.64 | 91,306 | 0.09 | 3 | - | - | - | - |
| Monticello | 8 - AA | 2-7 | -2.61 | 126,335 | 0.13 | 2 | - | - | - | - |
| Social Circle | 8 - AA | 2-7 | -8.16 | 46,091 | 0.05 | 2 | - | - | - | - |
| Bacon County | 2 - AA | 5-4 | 40.93 | - | - | - | - | - | - | - |
| Northeast | 3 - AA | 4-4 | 28.37 | - | - | - | - | - | - | - |
| Washington | 6 - AA | 3-6 | 22.20 | - | - | - | - | - | - | - |
| Metter | 2 - AA | 3-6 | 18.75 | - | - | - | - | - | - | - |
| Therrell | 6 - AA | 2-7 | 15.60 | - | - | - | - | - | - | - |
| Early County | 1 - AA | 2-7 | 14.93 | - | - | - | - | - | - | - |
| KIPP Atlanta Collegiate | 6 - AA | 2-6 | 13.81 | - | - | - | - | - | - | - |
| Dade County | 7 - AA | 3-6 | 11.83 | - | - | - | - | - | - | - |
| Laney | 4 - AA | 2-7 | 10.70 | - | - | - | - | - | - | - |
| Bryan County | 2 - AA | 0-8 | 4.57 | - | - | - | - | - | - | - |
| Gordon Central | 7 - AA | 2-7 | 2.82 | - | - | - | - | - | - | - |
| Armuchee | 7 - AA | 1-8 | 0.72 | - | - | - | - | - | - | - |
| Model | 7 - AA | 1-8 | 0.43 | - | - | - | - | - | - | - |
| East Laurens | 3 - AA | 0-9 | 0.26 | - | - | - | - | - | - | - |
| Westside (Augusta) | 4 - AA | 1-8 | -3.38 | - | - | - | - | - | - | - |
| Josey | 4 - AA | 1-8 | -11.31 | - | - | - | - | - | - | - |
| Oglethorpe County | 8 - AA | 0-9 | -31.08 | - | - | - | - | - | - | - |
Playoff Seeding Projections
Each team is shown with its region and the number of times of capturing each seed in the region plus the number of times the team did not make the playoffs.
| Region | Team | 1 | 2 | 3 | 4 | Out |
|---|---|---|---|---|---|---|
| 1 - AA | Thomasville | 890,409 | 88,483 | 21,108 | - | - |
| 1 - AA | Brooks County | 105,538 | 889,003 | 714 | 4,745 | - |
| 1 - AA | Fitzgerald | 4,053 | 20,942 | 972,716 | 2,289 | - |
| 1 - AA | Berrien | - | 1,572 | 5,462 | 992,966 | - |
| 1 - AA | Early County | - | - | - | - | 1,000,000 |
| 2 - AA | Benedictine | 1,000,000 | - | - | - | - |
| 2 - AA | Toombs County | - | 1,000,000 | - | - | - |
| 2 - AA | Vidalia | - | - | 1,000,000 | - | - |
| 2 - AA | Jeff Davis | - | - | - | 830,157 | 169,843 |
| 2 - AA | Swainsboro | - | - | - | 169,843 | 830,157 |
| 2 - AA | Bacon County | - | - | - | - | 1,000,000 |
| 2 - AA | Metter | - | - | - | - | 1,000,000 |
| 2 - AA | Bryan County | - | - | - | - | 1,000,000 |
| 3 - AA | Dodge County | 1,000,000 | - | - | - | - |
| 3 - AA | Bleckley County | - | 382,786 | 245,849 | 44,911 | 326,454 |
| 3 - AA | Dublin | - | 331,693 | 285,521 | 382,786 | - |
| 3 - AA | Washington County | - | 285,521 | 450,805 | 263,674 | - |
| 3 - AA | Southwest | - | - | 17,825 | 308,629 | 673,546 |
| 3 - AA | Northeast | - | - | - | - | 1,000,000 |
| 3 - AA | East Laurens | - | - | - | - | 1,000,000 |
| 4 - AA | Screven County | 607,443 | 392,557 | - | - | - |
| 4 - AA | Jefferson County | 392,557 | 607,443 | - | - | - |
| 4 - AA | Harlem | - | - | 1,000,000 | - | - |
| 4 - AA | Glenn Hills | - | - | - | 908,694 | 91,306 |
| 4 - AA | Butler | - | - | - | 91,306 | 908,694 |
| 4 - AA | Josey | - | - | - | - | 1,000,000 |
| 4 - AA | Laney | - | - | - | - | 1,000,000 |
| 4 - AA | Westside (Augusta) | - | - | - | - | 1,000,000 |
| 5 - AA | Heard County | 1,000,000 | - | - | - | - |
| 5 - AA | Callaway | - | 1,000,000 | - | - | - |
| 5 - AA | Temple | - | - | 642,475 | 42,941 | 314,584 |
| 5 - AA | Spencer | - | - | 357,525 | 642,475 | - |
| 5 - AA | Lamar County | - | - | - | 312,538 | 687,462 |
| 5 - AA | Jordan | - | - | - | 2,046 | 997,954 |
| 6 - AA | Hapeville Charter | 1,000,000 | - | - | - | - |
| 6 - AA | B.E.S.T. Academy | - | 1,000,000 | - | - | - |
| 6 - AA | Douglass | - | - | 1,000,000 | - | - |
| 6 - AA | South Atlanta | - | - | - | 1,000,000 | - |
| 6 - AA | KIPP Atlanta Collegiate | - | - | - | - | 1,000,000 |
| 6 - AA | Therrell | - | - | - | - | 1,000,000 |
| 6 - AA | Washington | - | - | - | - | 1,000,000 |
| 7 - AA | Rockmart | 1,000,000 | - | - | - | - |
| 7 - AA | Pepperell | - | 867,676 | 47,647 | 84,677 | - |
| 7 - AA | Chattooga | - | 132,324 | 23,665 | 844,011 | - |
| 7 - AA | Coosa | - | - | 928,688 | 71,312 | - |
| 7 - AA | Dade County | - | - | - | - | 1,000,000 |
| 7 - AA | Model | - | - | - | - | 1,000,000 |
| 7 - AA | Armuchee | - | - | - | - | 1,000,000 |
| 7 - AA | Gordon Central | - | - | - | - | 1,000,000 |
| 8 - AA | Rabun County | 1,000,000 | - | - | - | - |
| 8 - AA | Elbert County | - | 900,810 | 99,190 | - | - |
| 8 - AA | Banks County | - | 99,190 | 900,810 | - | - |
| 8 - AA | Putnam County | - | - | - | 827,574 | 172,426 |
| 8 - AA | Monticello | - | - | - | 126,335 | 873,665 |
| 8 - AA | Social Circle | - | - | - | 46,091 | 953,909 |
| 8 - AA | Oglethorpe County | - | - | - | - | 1,000,000 |
Class A-Public
Modal Bracket
Although any specific bracket is highly unlikely, the modal bracket represents the most probable of all the possible brackets.

Playoff Projections by Team
Each team is shown with its region, rating, the number of times making it to the finals, and the number of times of winning the state championship along with the associated odds.
| Team | Region | Record | Rating | Playoffs | Qtrfinals | Semifinals | Finals | Champion | Odds |
|---|---|---|---|---|---|---|---|---|---|
| Irwin County | 2 - A | 8-1 | 52.37 | 1,000,000 | 922,755 | 748,336 | 517,107 | 347,841 | 1.87 |
| Clinch County | 2 - A | 7-2 | 51.15 | 1,000,000 | 861,737 | 648,909 | 394,804 | 248,265 | 3.03 |
| Manchester | 4 - A | 9-0 | 47.48 | 1,000,000 | 802,454 | 527,740 | 336,714 | 155,486 | 5.43 |
| Macon County | 4 - A | 7-2 | 47.25 | 1,000,000 | 794,809 | 519,739 | 324,106 | 147,775 | 5.77 |
| Charlton County | 2 - A | 6-2 | 38.86 | 1,000,000 | 602,291 | 247,268 | 89,275 | 25,165 | 38.74 |
| Mount Zion (Carroll) | 6 - A | 8-1 | 38.80 | 1,000,000 | 520,928 | 235,571 | 80,497 | 22,765 | 42.93 |
| Commerce | 8 - A | 7-2 | 36.74 | 1,000,000 | 593,263 | 224,457 | 65,933 | 16,369 | 60.09 |
| Marion County | 4 - A | 8-1 | 36.85 | 1,000,000 | 389,258 | 167,012 | 50,714 | 12,237 | 80.72 |
| Trion | 6 - A | 7-2 | 36.32 | 1,000,000 | 349,787 | 146,753 | 44,153 | 9,741 | 101.66 |
| Emanuel County Institute | 3 - A | 8-1 | 33.36 | 1,000,000 | 487,649 | 155,272 | 38,413 | 7,299 | 136.01 |
| Taylor County | 4 - A | 7-2 | 30.04 | 999,997 | 218,382 | 63,093 | 11,429 | 1,547 | 645.41 |
| Dooly County | 4 - A | 3-6 | 30.74 | 981,652 | 149,874 | 50,440 | 10,356 | 1,471 | 678.81 |
| Turner County | 2 - A | 6-3 | 28.87 | 1,000,000 | 175,486 | 48,856 | 8,415 | 1,020 | 979.39 |
| Lincoln County | 7 - A | 5-4 | 28.82 | 996,863 | 160,298 | 42,933 | 7,429 | 950 | 1,051.63 |
| Telfair County | 2 - A | 4-5 | 29.16 | 999,930 | 125,769 | 28,911 | 5,305 | 726 | 1,376.41 |
| Washington-Wilkes | 7 - A | 5-4 | 27.71 | 1,000,000 | 153,185 | 37,679 | 5,786 | 683 | 1,463.13 |
| Schley County | 4 - A | 6-3 | 28.03 | 608,095 | 68,163 | 13,724 | 2,111 | 272 | 3,675.47 |
| Mitchell County | 1 - A | 8-1 | 19.59 | 1,000,000 | 239,479 | 41,249 | 3,584 | 190 | 5,262.16 |
| Pelham | 1 - A | 8-1 | 17.40 | 1,000,000 | 223,036 | 31,882 | 2,235 | 98 | 10,203.08 |
| Jenkins County | 3 - A | 7-2 | 20.81 | 1,000,000 | 81,945 | 12,245 | 1,117 | 71 | 14,083.51 |
| Towns County | 8 - A | 4-5 | 19.17 | 946,424 | 42,031 | 5,037 | 404 | 27 | 37,036.04 |
| Montgomery County | 3 - A | 6-3 | 14.85 | 186,871 | 4,247 | 447 | 35 | 2 | 499,999.00 |
| Chattahoochee County | 1 - A | 6-3 | 10.35 | 1,000,000 | 18,478 | 1,780 | 66 | - | - |
| Miller County | 1 - A | 6-3 | 6.00 | 1,000,000 | 7,938 | 329 | 5 | - | - |
| Johnson County | 3 - A | 5-4 | 8.38 | 331,911 | 2,563 | 152 | 5 | - | - |
| Seminole County | 1 - A | 5-4 | 2.81 | 948,257 | 4,195 | 186 | 2 | - | - |
| Wilcox County | 2 - A | 2-7 | 15.47 | - | - | - | - | - | - |
| McIntosh County Academy | 3 - A | 2-6 | 7.68 | - | - | - | - | - | - |
| Bowdon | 6 - A | 2-7 | 6.96 | - | - | - | - | - | - |
| Claxton | 3 - A | 2-7 | 6.95 | - | - | - | - | - | - |
| Gordon Lee | 6 - A | 2-7 | 6.89 | - | - | - | - | - | - |
| Wilkinson County | 7 - A | 2-7 | 6.70 | - | - | - | - | - | - |
| Atkinson County | 2 - A | 1-8 | 6.13 | - | - | - | - | - | - |
| Hawkinsville | 4 - A | 1-8 | 4.06 | - | - | - | - | - | - |
| Hancock Central | 7 - A | 2-7 | 1.79 | - | - | - | - | - | - |
| Greene County | 7 - A | 3-6 | 0.88 | - | - | - | - | - | - |
| Lanier County | 2 - A | 1-8 | -3.36 | - | - | - | - | - | - |
| Wheeler County | 3 - A | 4-5 | -3.46 | - | - | - | - | - | - |
| Portal | 3 - A | 1-8 | -5.93 | - | - | - | - | - | - |
| Greenville | 4 - A | 2-7 | -8.09 | - | - | - | - | - | - |
| Twiggs County | 7 - A | 0-9 | -10.87 | - | - | - | - | - | - |
| Treutlen | 3 - A | 1-8 | -11.72 | - | - | - | - | - | - |
| Terrell County | 1 - A | 2-7 | -15.09 | - | - | - | - | - | - |
| Central (Talbotton) | 4 - A | 2-7 | -15.95 | - | - | - | - | - | - |
| Warren County | 7 - A | 0-9 | -17.22 | - | - | - | - | - | - |
| Baconton Charter | 1 - A | 3-6 | -17.33 | - | - | - | - | - | - |
| Calhoun County | 1 - A | 2-7 | -17.90 | - | - | - | - | - | - |
| Crawford County | 4 - A | 3-6 | -20.60 | - | - | - | - | - | - |
| Randolph-Clay | 1 - A | 2-7 | -23.06 | - | - | - | - | - | - |
| Stewart County | 1 - A | 1-8 | -34.42 | - | - | - | - | - | - |
Playoff Seeding Projections
Each team is shown with its region and the number of times of capturing each seed in the region plus the number of times the team did not make the playoffs.
| Region | Team | Reg Chmp | Seed 1 - 8 | Seed 9 - 24 | Out |
|---|---|---|---|---|---|
| 1 - A | Mitchell County | 590,274 | 746,450 | 253,550 | - |
| 1 - A | Pelham | 409,726 | 954,333 | 45,667 | - |
| 1 - A | Chattahoochee County | - | 4,108 | 995,892 | - |
| 1 - A | Miller County | - | - | 1,000,000 | - |
| 1 - A | Seminole County | - | - | 948,257 | 51,743 |
| 1 - A | Randolph-Clay | - | - | - | 1,000,000 |
| 1 - A | Calhoun County | - | - | - | 1,000,000 |
| 1 - A | Terrell County | - | - | - | 1,000,000 |
| 1 - A | Baconton Charter | - | - | - | 1,000,000 |
| 1 - A | Stewart County | - | - | - | 1,000,000 |
| 2 - A | Irwin County | 1,000,000 | 1,000,000 | - | - |
| 2 - A | Clinch County | - | 947,086 | 52,914 | - |
| 2 - A | Charlton County | - | 613,149 | 386,851 | - |
| 2 - A | Turner County | - | 19 | 999,981 | - |
| 2 - A | Telfair County | - | - | 999,930 | 70 |
| 2 - A | Wilcox County | - | - | - | 1,000,000 |
| 2 - A | Atkinson County | - | - | - | 1,000,000 |
| 2 - A | Lanier County | - | - | - | 1,000,000 |
| 3 - A | Emanuel County Institute | 509,894 | 747,716 | 252,284 | - |
| 3 - A | Jenkins County | - | 131 | 999,869 | - |
| 3 - A | Johnson County | - | - | 331,911 | 668,089 |
| 3 - A | Montgomery County | - | - | 186,871 | 813,129 |
| 3 - A | McIntosh County Academy | - | - | - | 1,000,000 |
| 3 - A | Portal | - | - | - | 1,000,000 |
| 3 - A | Claxton | - | - | - | 1,000,000 |
| 3 - A | Treutlen | - | - | - | 1,000,000 |
| 3 - A | Wheeler County | - | - | - | 1,000,000 |
| 4 - A | Macon County | 527,135 | 762,318 | 237,682 | - |
| 4 - A | Manchester | 472,865 | 758,159 | 241,841 | - |
| 4 - A | Marion County | - | 124,903 | 875,097 | - |
| 4 - A | Taylor County | - | - | 999,997 | 3 |
| 4 - A | Dooly County | - | - | 981,652 | 18,348 |
| 4 - A | Schley County | - | - | 608,095 | 391,905 |
| 4 - A | Hawkinsville | - | - | - | 1,000,000 |
| 4 - A | Crawford County | - | - | - | 1,000,000 |
| 4 - A | Greenville | - | - | - | 1,000,000 |
| 4 - A | Central (Talbotton) | - | - | - | 1,000,000 |
| 6 - A | Mount Zion (Carroll) | 284,372 | 483,466 | 516,534 | - |
| 6 - A | Trion | - | 21,143 | 978,857 | - |
| 6 - A | Gordon Lee | - | - | - | 1,000,000 |
| 6 - A | Bowdon | - | - | - | 1,000,000 |
| 7 - A | Washington-Wilkes | - | 133 | 999,867 | - |
| 7 - A | Lincoln County | - | - | 996,863 | 3,137 |
| 7 - A | Greene County | - | - | - | 1,000,000 |
| 7 - A | Wilkinson County | - | - | - | 1,000,000 |
| 7 - A | Warren County | - | - | - | 1,000,000 |
| 7 - A | Twiggs County | - | - | - | 1,000,000 |
| 7 - A | Hancock Central | - | - | - | 1,000,000 |
| 8 - A | Commerce | - | 836,886 | 163,114 | - |
| 8 - A | Towns County | - | - | 946,424 | 53,576 |
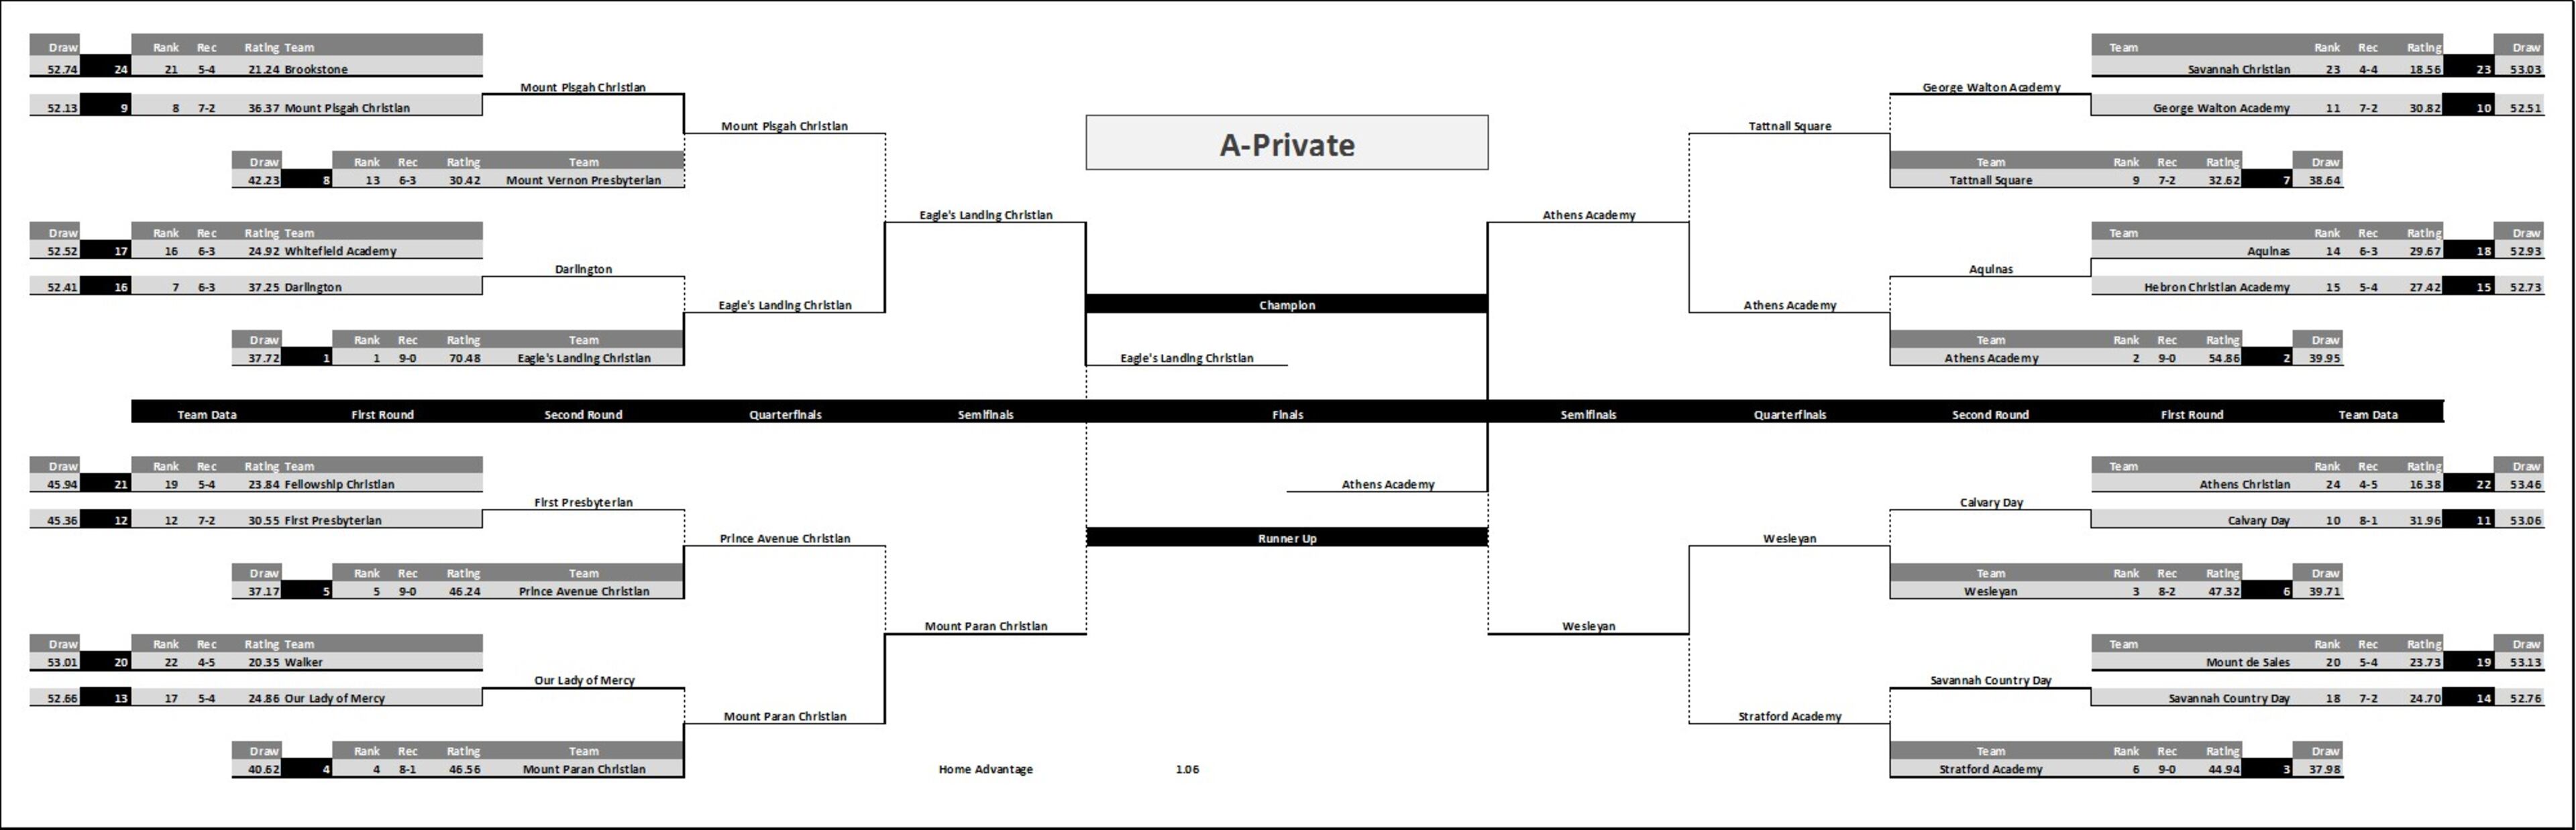
Class A-Private
Modal Bracket
Although any specific bracket is highly unlikely, the modal bracket represents the most probable of all the possible brackets.
Playoff Projections by Team
Each team is shown with its region, rating, the number of times making it to the finals, and the number of times of winning the state championship along with the associated odds.
| Team | Region | Record | Rating | Playoffs | Qtrfinals | Semifinals | Finals | Champion | Odds |
|---|---|---|---|---|---|---|---|---|---|
| Eagle's Landing Christian | 5 - A | 9-0 | 70.48 | 1,000,000 | 984,621 | 961,937 | 893,477 | 786,744 | 0.27 |
| Athens Academy | 8 - A | 9-0 | 54.86 | 1,000,000 | 931,104 | 752,931 | 487,650 | 120,070 | 7.33 |
| Wesleyan | 5 - A | 8-2 | 47.32 | 1,000,000 | 866,470 | 433,463 | 171,979 | 24,694 | 39.50 |
| Prince Avenue Christian | 8 - A | 9-0 | 46.24 | 1,000,000 | 861,267 | 528,016 | 145,364 | 24,404 | 39.98 |
| Mount Paran Christian | 6 - A | 8-1 | 46.56 | 1,000,000 | 862,857 | 482,740 | 127,281 | 23,115 | 42.26 |
| Stratford Academy | 7 - A | 9-0 | 44.94 | 1,000,000 | 841,994 | 422,307 | 125,983 | 17,160 | 57.28 |
| Mount Pisgah Christian | 6 - A | 7-2 | 36.37 | 1,000,000 | 369,531 | 61,647 | 10,761 | 1,047 | 954.11 |
| Darlington | 6 - A | 6-3 | 37.25 | 1,000,000 | 177,522 | 63,193 | 10,670 | 947 | 1,054.97 |
| Calvary Day | 3 - A | 8-1 | 31.96 | 1,000,000 | 524,045 | 104,219 | 7,530 | 579 | 1,726.12 |
| Tattnall Square | 7 - A | 7-2 | 32.62 | 1,000,000 | 325,902 | 35,221 | 5,027 | 392 | 2,550.02 |
| George Walton Academy | 8 - A | 7-2 | 30.82 | 1,000,000 | 352,389 | 29,887 | 4,849 | 257 | 3,890.05 |
| Mount Vernon Presbyterian | 5 - A | 6-3 | 30.42 | 1,000,000 | 331,901 | 21,447 | 2,954 | 218 | 4,586.16 |
| Aquinas | 7 - A | 6-3 | 29.67 | 1,000,000 | 114,723 | 31,612 | 1,994 | 149 | 6,710.41 |
| First Presbyterian | 7 - A | 7-2 | 30.55 | 1,000,000 | 108,412 | 25,512 | 2,029 | 140 | 7,141.86 |
| Hebron Christian Academy | 8 - A | 5-4 | 27.42 | 1,000,000 | 39,850 | 8,087 | 798 | 25 | 39,999.00 |
| Our Lady of Mercy | 5 - A | 5-4 | 24.86 | 1,000,000 | 64,758 | 10,055 | 366 | 18 | 55,554.56 |
| Savannah Country Day | 3 - A | 7-2 | 24.70 | 1,000,000 | 63,136 | 9,458 | 402 | 13 | 76,922.08 |
| Mount de Sales | 7 - A | 5-4 | 23.73 | 976,965 | 42,138 | 5,741 | 223 | 11 | 90,908.09 |
| Fellowship Christian | 6 - A | 5-4 | 23.84 | 848,373 | 36,571 | 3,876 | 191 | 7 | 142,856.14 |
| Whitefield Academy | 6 - A | 6-3 | 24.92 | 1,000,000 | 22,929 | 3,983 | 341 | 6 | 166,665.67 |
| Walker | 6 - A | 4-5 | 20.35 | 751,870 | 20,228 | 1,792 | 48 | 2 | 499,999.00 |
| Brookstone | 4 - A | 5-4 | 21.24 | 325,056 | 10,367 | 823 | 18 | 1 | 999,999.00 |
| Strong Rock Christian | 5 - A | 4-5 | 16.34 | 767,253 | 12,664 | 352 | 11 | 1 | 999,999.00 |
| Savannah Christian | 3 - A | 4-4 | 18.56 | 911,014 | 17,374 | 916 | 30 | - | - |
| Athens Christian | 8 - A | 4-5 | 16.38 | 970,407 | 11,654 | 554 | 17 | - | - |
| Holy Innocents | 5 - A | 3-6 | 15.17 | 328,936 | 3,489 | 190 | 4 | - | - |
| North Cobb Christian | 6 - A | 4-5 | 15.98 | 120,126 | 2,104 | 41 | 3 | - | - |
| St. Francis | 6 - A | 3-6 | 10.61 | - | - | - | - | - | - |
| Lakeview Academy | 8 - A | 2-7 | 7.47 | - | - | - | - | - | - |
| Riverside Military Academy | 8 - A | 1-8 | 3.24 | - | - | - | - | - | - |
| Christian Heritage | 6 - A | 1-8 | 1.27 | - | - | - | - | - | - |
| King's Ridge Christian | 6 - A | 2-7 | -1.64 | - | - | - | - | - | - |
| Providence Christian | 8 - A | 1-8 | -1.68 | - | - | - | - | - | - |
| Pinecrest Academy | 6 - A | 0-9 | -6.34 | - | - | - | - | - | - |
| Landmark Christian | 5 - A | 0-9 | -7.55 | - | - | - | - | - | - |
| Pacelli | 4 - A | 0-9 | -42.52 | - | - | - | - | - | - |
Playoff Seeding Projections
Each team is shown with its region and the number of times of capturing each seed in the region plus the number of times the team did not make the playoffs.
| Region | Team | Reg Chmp | Seed 1 - 8 | Seed 9 - 24 | Out |
|---|---|---|---|---|---|
| 3 - A | Calvary Day | 490,106 | 726,799 | 273,201 | - |
| 3 - A | Savannah Country Day | - | - | 1,000,000 | - |
| 3 - A | Savannah Christian | - | - | 911,014 | 88,986 |
| 4 - A | Brookstone | - | - | 325,056 | 674,944 |
| 4 - A | Pacelli | - | - | - | 1,000,000 |
| 5 - A | Eagle's Landing Christian | 1,000,000 | 1,000,000 | - | - |
| 5 - A | Wesleyan | - | 1,000,000 | - | - |
| 5 - A | Mount Vernon Presbyterian | - | 369,533 | 630,467 | - |
| 5 - A | Our Lady of Mercy | - | 31 | 999,969 | - |
| 5 - A | Strong Rock Christian | - | - | 767,253 | 232,747 |
| 5 - A | Holy Innocents | - | - | 328,936 | 671,064 |
| 5 - A | Landmark Christian | - | - | - | 1,000,000 |
| 6 - A | Mount Paran Christian | 715,628 | 993,011 | 6,989 | - |
| 6 - A | Mount Pisgah Christian | - | 146,449 | 853,551 | - |
| 6 - A | Darlington | - | 28 | 999,972 | - |
| 6 - A | Whitefield Academy | - | - | 1,000,000 | - |
| 6 - A | Fellowship Christian | - | - | 848,373 | 151,627 |
| 6 - A | Walker | - | - | 751,870 | 248,130 |
| 6 - A | North Cobb Christian | - | - | 120,126 | 879,874 |
| 6 - A | Pinecrest Academy | - | - | - | 1,000,000 |
| 6 - A | St. Francis | - | - | - | 1,000,000 |
| 6 - A | Christian Heritage | - | - | - | 1,000,000 |
| 6 - A | King's Ridge Christian | - | - | - | 1,000,000 |
| 7 - A | Stratford Academy | 842,194 | 993,188 | 6,812 | - |
| 7 - A | Aquinas | 157,806 | 157,806 | 842,194 | - |
| 7 - A | Tattnall Square | - | 203,266 | 796,734 | - |
| 7 - A | First Presbyterian | - | 92 | 999,908 | - |
| 7 - A | Mount de Sales | - | - | 976,965 | 23,035 |
| 8 - A | Athens Academy | 732,455 | 1,000,000 | - | - |
| 8 - A | Prince Avenue Christian | 267,545 | 1,000,000 | - | - |
| 8 - A | George Walton Academy | - | 409,797 | 590,203 | - |
| 8 - A | Hebron Christian Academy | - | - | 1,000,000 | - |
| 8 - A | Athens Christian | - | - | 970,407 | 29,593 |
| 8 - A | Lakeview Academy | - | - | - | 1,000,000 |
| 8 - A | Riverside Military Academy | - | - | - | 1,000,000 |
| 8 - A | Providence Christian | - | - | - | 1,000,000 |