Maxwell Class A Playoff projections
The Maxwell Ratings playoff projections are based on a Monte Carlo simulation of the 2014 season. The simulation completed 1,000,000 seasons, approximately 51 each second.
While the Maxwell Ratings reflect each team’s strength, the simulation highlights the impact of the season’s structure as defined by the games, region alignments, and playoff brackets.
All out of state opponents were considered equal to the average of the GHSA team’s classification (i.e., out of state opponents of Class AA GHSA teams were treated as an average Class AA team).
Although regions may use different criteria, in the simulation all standings were determined by using recursive head-to-head records with all ties being broken randomly.
Modal Brackets
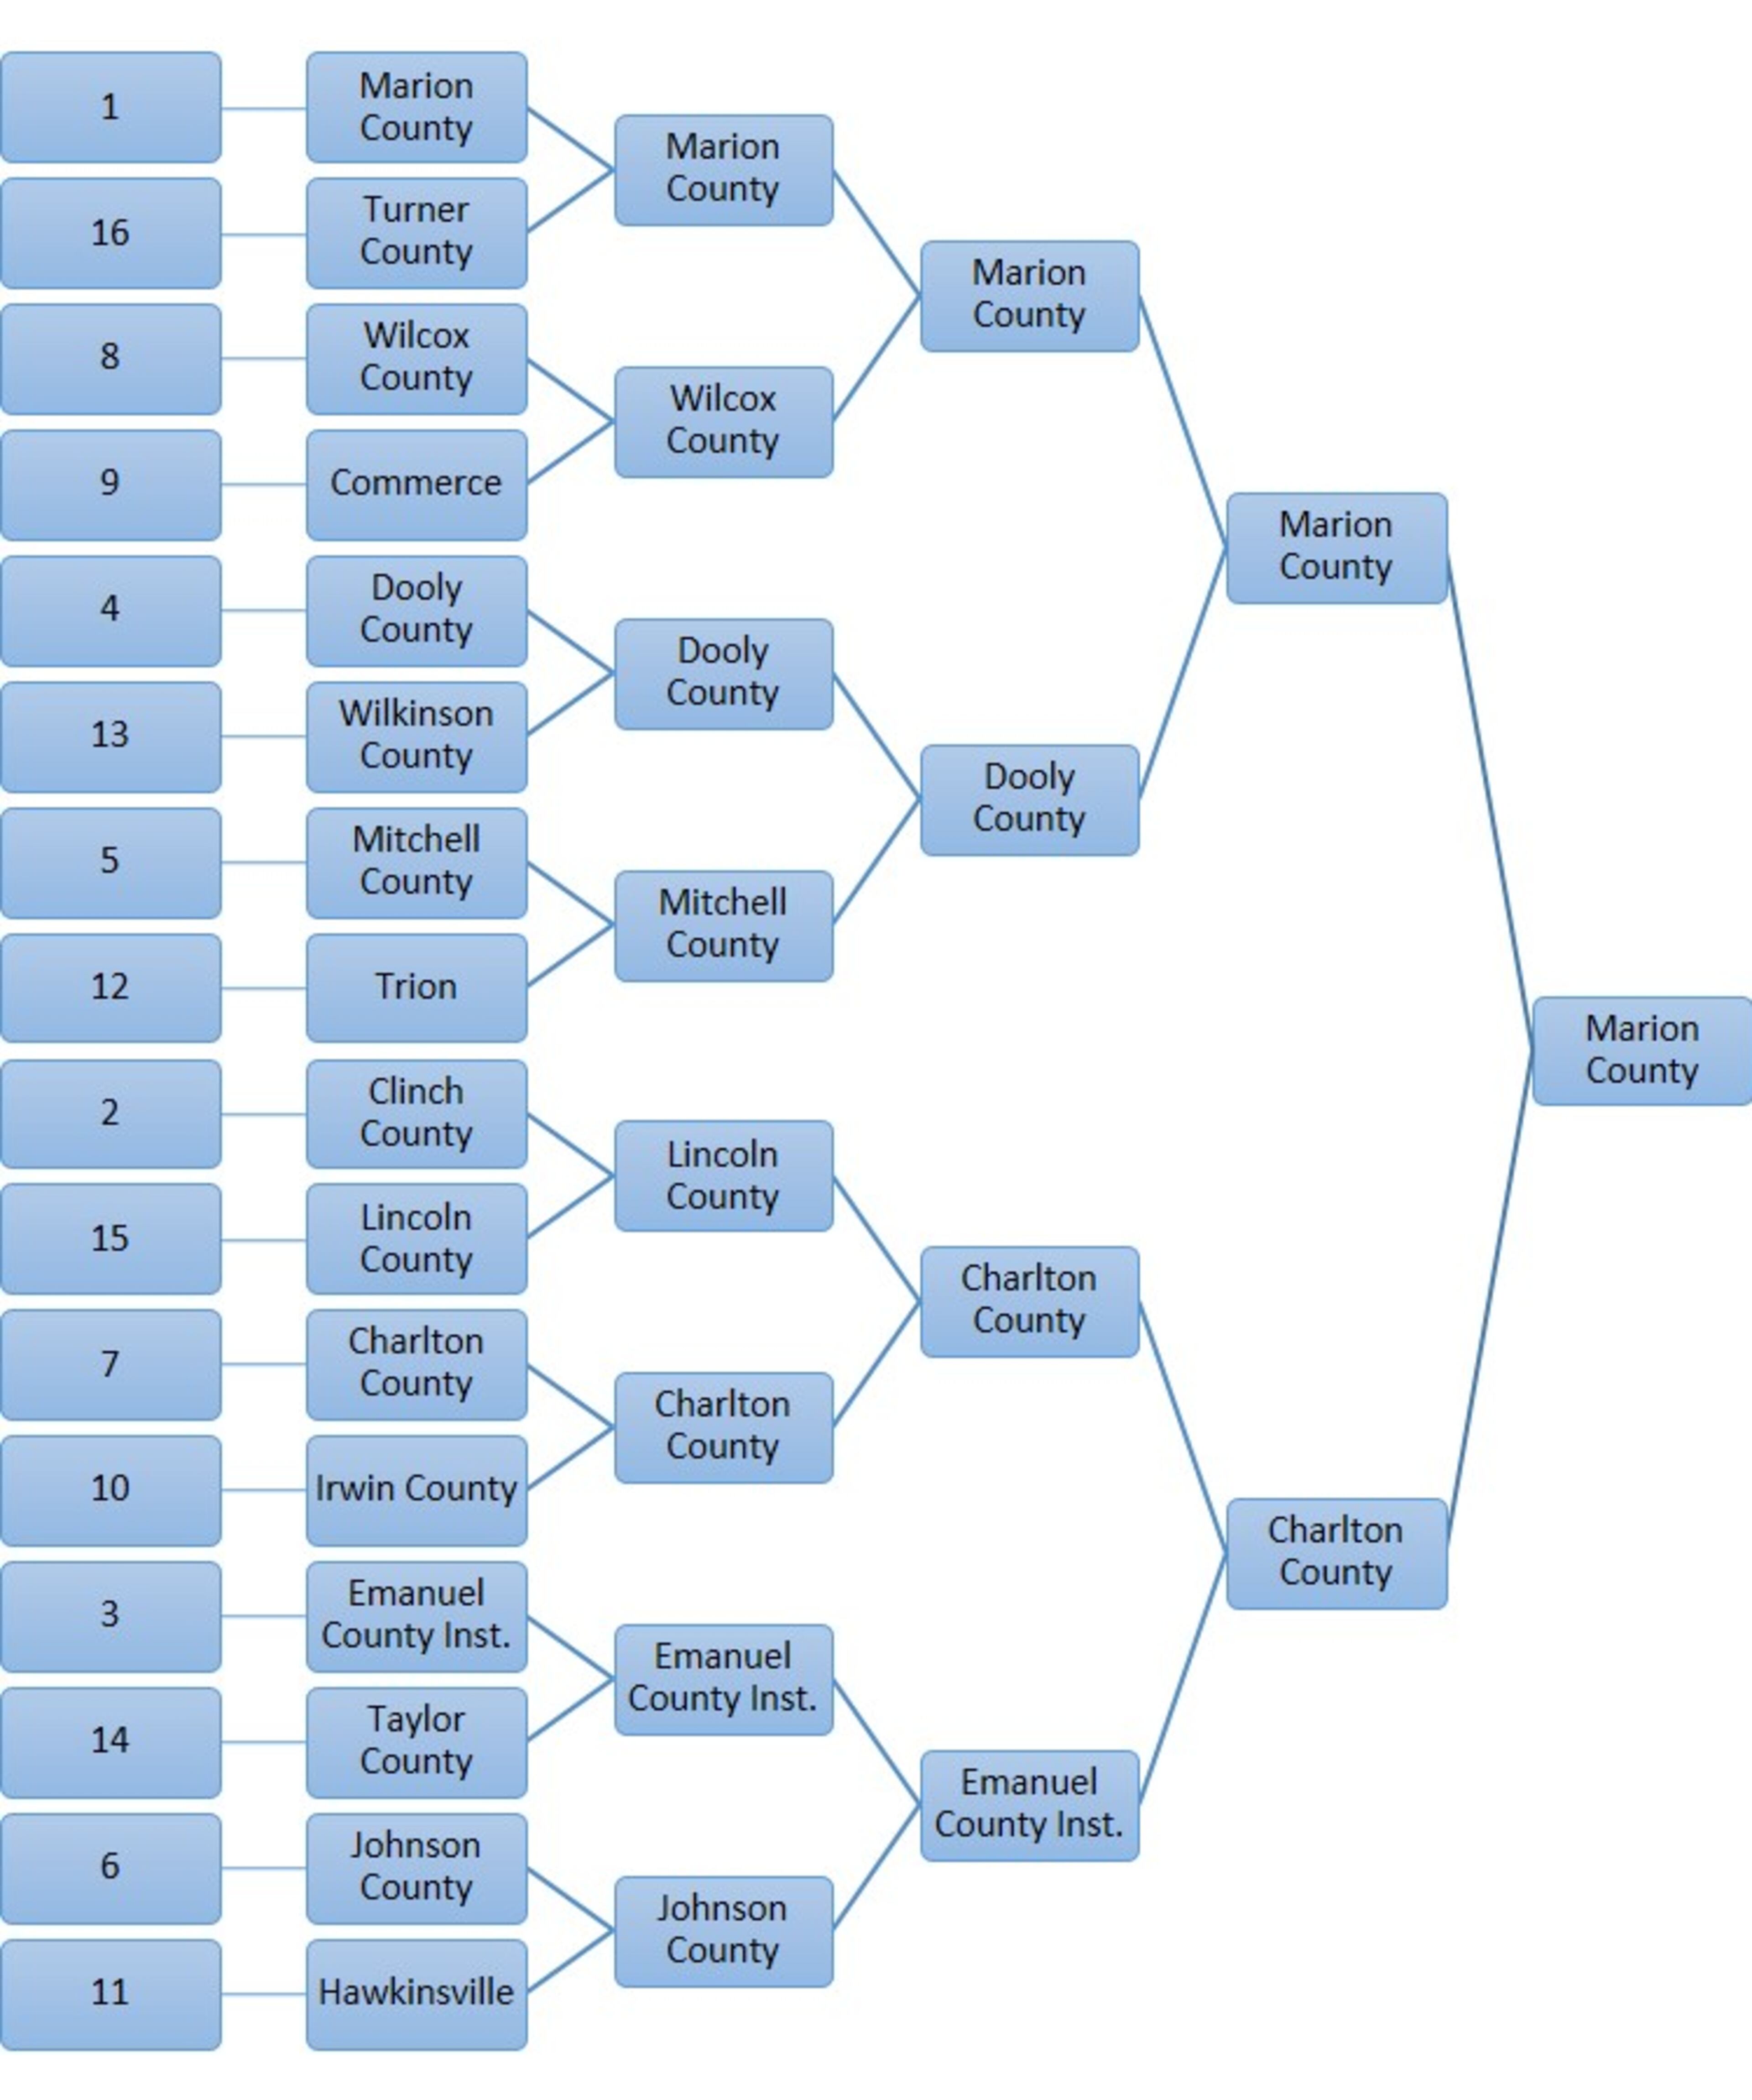
Although any specific bracket is highly unlikely, the modal bracket represents the most probable of all the possible brackets. In the Class A Private bracket, there are 1.03 x 10^26 possible brackets and in the Class A Public bracket, there are 3.71 x 10^27 possible brackets. For comparison, scientists estimate there are 7.5 x 10^18 grains of sand on earth.
Class A Public Bracket
Class A Private Bracket

Playoff Projections by Region
Each region is shown with the number of teams that have a greater than average chance of winning the state championship, the number of times it is represented in the finals out of a possible 2,000,000 times, and the number of times it is represented by the state champion along with the associated odds.
| Region | > Avg | Finals | Champion | Odds |
|---|---|---|---|---|
| 5 - A | 2 | 849,923 | 645,031 | 0.55 |
| 4 - A | 3 | 731,556 | 409,632 | 1.44 |
| 2 - A | 4 | 700,376 | 339,992 | 1.94 |
| 7 - A | 4 | 700,904 | 288,760 | 2.46 |
| 3 - A | 3 | 510,266 | 186,097 | 4.37 |
| 8 - A | 1 | 355,208 | 99,732 | 9.03 |
| 6 - A | 0 | 123,523 | 24,468 | 39.87 |
| 1 - A | 0 | 28,244 | 6,288 | 158.49 |
Playoff Projections by Team
Each team is shown with the number of times it made the playoffs, its average depth into the playoffs, the number of times of making it to the finals, and the number of times of winning the state championship along with the associated odds.
Class A Public Schools
| Team | Rating | Playoffs | Avg Depth | Finals | Champion | Odds |
|---|---|---|---|---|---|---|
| Marion County | 46.38 | 999,091 | 2.99 | 388,239 | 253,053 | 2.95 |
| Dooly County | 42.68 | 976,095 | 2.42 | 233,513 | 124,172 | 7.05 |
| Charlton County | 43.37 | 912,856 | 2.26 | 224,377 | 123,020 | 7.13 |
| Lincoln County | 44.58 | 653,151 | 1.68 | 176,276 | 103,337 | 8.68 |
| Clinch County | 40.92 | 977,860 | 2.21 | 181,210 | 85,915 | 10.64 |
| Irwin County | 40.84 | 899,425 | 1.98 | 153,604 | 72,886 | 12.72 |
| Emanuel County Institute | 39.68 | 962,544 | 2.14 | 161,184 | 71,396 | 13.01 |
| Wilcox County | 39.28 | 908,103 | 1.88 | 125,282 | 54,350 | 17.40 |
| Johnson County | 36.61 | 906,018 | 1.71 | 84,554 | 31,140 | 31.11 |
| Hawkinsville | 35.89 | 864,684 | 1.54 | 65,204 | 22,925 | 42.62 |
| Wilkinson County | 35.56 | 811,917 | 1.43 | 57,654 | 20,155 | 48.62 |
| Commerce | 32.51 | 971,970 | 1.54 | 39,768 | 11,022 | 89.73 |
| Trion | 31.08 | 838,649 | 1.30 | 28,469 | 7,257 | 136.80 |
| Taylor County | 31.66 | 777,762 | 1.18 | 25,224 | 6,714 | 147.94 |
| Mitchell County | 30.19 | 757,872 | 1.18 | 23,478 | 5,575 | 178.37 |
| Turner County | 30.48 | 637,055 | 0.92 | 15,557 | 3,787 | 263.06 |
| Claxton | 29.78 | 457,035 | 0.66 | 10,484 | 2,466 | 404.52 |
| Miller County | 24.24 | 546,445 | 0.72 | 4,536 | 690 | 1,448.28 |
| Hancock Central | 19.57 | 229,230 | 0.26 | 459 | 58 | 17,240.38 |
| Telfair County | 19.46 | 175,253 | 0.20 | 334 | 33 | 30,302.03 |
| Terrell County | 15.60 | 165,658 | 0.19 | 175 | 18 | 55,554.56 |
| Treutlen | 17.59 | 131,439 | 0.15 | 212 | 17 | 58,822.53 |
| Greenville | 17.38 | 85,797 | 0.10 | 86 | 6 | 166,665.67 |
| Randolph-Clay | 12.46 | 154,503 | 0.17 | 55 | 5 | 199,999.00 |
| Portal | 16.23 | 40,840 | 0.05 | 31 | 2 | 499,999.00 |
| Lanier County | 13.02 | 22,379 | 0.02 | 10 | 1 | 999,999.00 |
| Mount Zion (Carroll) | 14.36 | 17,400 | 0.02 | 9 | - | - |
| Schley County | 11.80 | 37,624 | 0.04 | 9 | - | - |
| Georgia Military College | 10.63 | 2,352 | 0.00 | - | - | - |
| Wheeler County | 8.81 | 25,923 | 0.03 | 4 | - | - |
| Jenkins County | 7.18 | 10,074 | 0.01 | 1 | - | - |
| Calhoun County | 5.99 | 18,106 | 0.02 | - | - | - |
| Atkinson County | 5.22 | 10,711 | 0.01 | 2 | - | - |
| Montgomery County | 2.46 | 2,400 | 0.00 | - | - | - |
| Twiggs County | -0.29 | 14 | 0.00 | - | - | - |
| Towns County | -2.38 | 11,665 | 0.01 | - | - | - |
| Warren County | -9.85 | 18 | 0.00 | - | - | - |
| Central (Talbotton) | -11.91 | 82 | 0.00 | - | - | - |
| Glascock County | -6.75 | - | 0.00 | - | - | - |
| Stewart County | -21.46 | - | 0.00 | - | - | - |
Class A Private Schools
| Team | Rating | Playoffs | Avg Depth | Finals | Champion | Odds |
|---|---|---|---|---|---|---|
| Eagle's Landing Christian | 62.81 | 991,331 | 4.09 | 725,068 | 613,453 | 0.63 |
| Aquinas | 51.00 | 986,916 | 2.80 | 323,228 | 135,345 | 6.39 |
| Calvary Day | 47.57 | 984,387 | 2.49 | 225,495 | 75,992 | 12.16 |
| Prince Avenue Christian | 47.27 | 995,364 | 2.52 | 235,733 | 75,454 | 12.25 |
| Landmark Christian | 43.58 | 952,503 | 1.90 | 100,736 | 27,540 | 35.31 |
| Stratford Academy | 41.54 | 886,264 | 1.69 | 75,171 | 17,125 | 57.39 |
| Tattnall Square | 39.52 | 892,378 | 1.59 | 54,239 | 10,857 | 91.11 |
| George Walton Academy | 38.50 | 966,376 | 1.67 | 49,989 | 9,029 | 109.75 |
| Mount Paran Christian | 38.52 | 836,246 | 1.48 | 45,303 | 8,528 | 116.26 |
| Mount Pisgah Christian | 38.13 | 879,279 | 1.57 | 46,522 | 8,468 | 117.09 |
| Savannah Christian | 37.65 | 735,812 | 1.17 | 28,293 | 5,084 | 195.70 |
| Our Lady of Mercy | 36.54 | 843,316 | 1.28 | 24,119 | 4,038 | 246.65 |
| Athens Academy | 35.93 | 867,906 | 1.32 | 23,951 | 3,674 | 271.18 |
| Brookstone | 35.23 | 807,512 | 1.20 | 19,257 | 2,762 | 361.06 |
| First Presbyterian | 34.81 | 624,040 | 0.90 | 13,096 | 1,826 | 546.65 |
| Athens Christian | 29.06 | 925,542 | 1.20 | 5,767 | 553 | 1,807.32 |
| Whitefield Academy | 25.70 | 509,246 | 0.62 | 1,573 | 108 | 9,258.26 |
| Mount de Sales | 26.94 | 233,265 | 0.28 | 781 | 57 | 17,542.86 |
| Christian Heritage | 26.07 | 171,861 | 0.21 | 554 | 41 | 24,389.24 |
| Walker | 24.31 | 285,349 | 0.34 | 626 | 36 | 27,776.78 |
| King's Ridge Christian | 23.68 | 145,361 | 0.17 | 289 | 21 | 47,618.05 |
| Pinecrest Academy | 20.87 | 197,890 | 0.22 | 169 | 9 | 111,110.11 |
| Pacelli | 19.27 | 52,738 | 0.06 | 24 | - | - |
| Savannah Country Day | 18.56 | 8,342 | 0.01 | 8 | - | - |
| Fellowship Christian | 13.90 | 56,980 | 0.06 | 9 | - | - |
| St. Francis | 4.98 | 9,639 | 0.01 | - | - | - |
| Strong Rock Christian | 3.53 | 1,061 | 0.00 | - | - | - |
| Lakeview Academy | 3.44 | 19,843 | 0.02 | - | - | - |
| Mount Vernon Presbyterian | -3.55 | 132,618 | 0.13 | - | - | - |
| Hebron Christian Academy | -6.48 | 587 | 0.00 | - | - | - |
| Baconton | -14.11 | 48 | 0.00 | - | - | - |
| Providence Christian | -30.56 | - | 0.00 | - | - | - |
| North Cobb Christian | -25.73 | - | 0.00 | - | - | - |