Atlanta Braves Holdings releases third quarter financial report

On Wednesday, Atlanta Braves Holdings, Inc. reported financial results for its third quarter that ended Sept. 30.
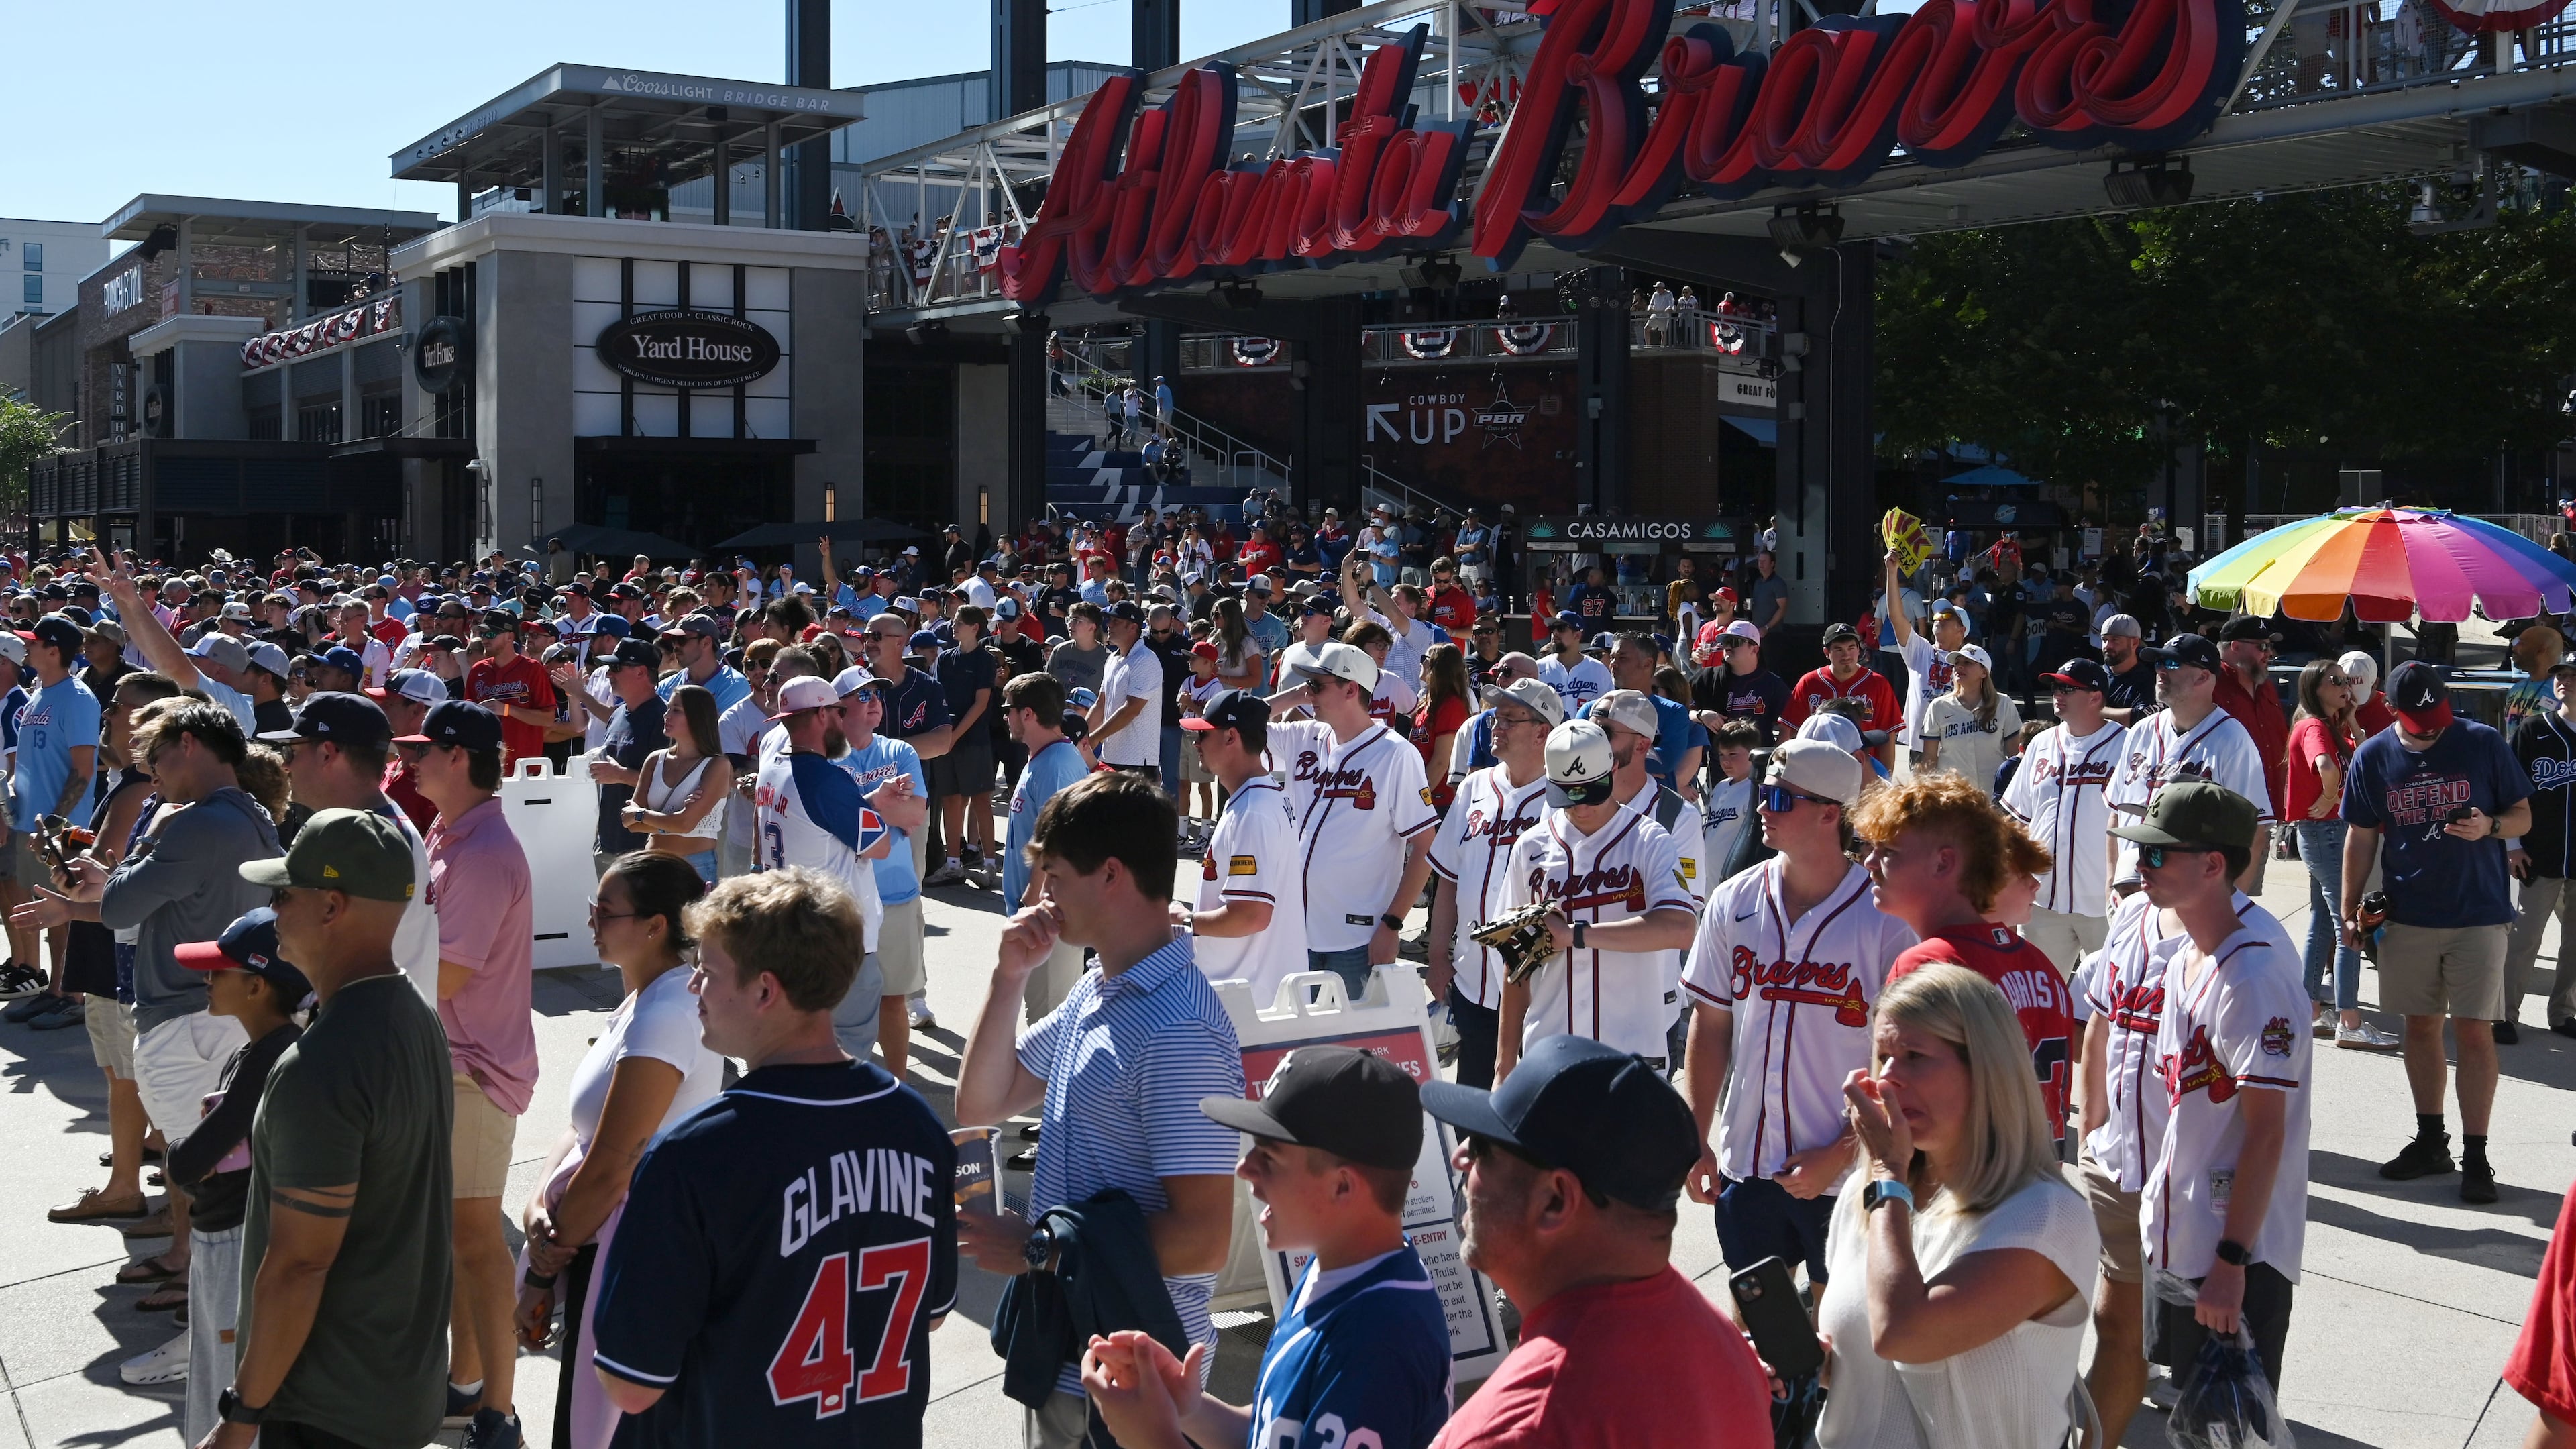
Per a release, the Braves saw a 14% increase in average attendance per regular season home games in the third quarter from the prior year period. The team won 94 games and clinched the NL East division title Sept. 20.
Total revenue for the club grew to $325 million in the third quarter, up 4% from the prior year period. Baseball revenue increased 4% from the prior year period to $296 million driven by increases in baseball event revenue, and mixed-use development revenue increased 7% from the prior year period to $29 million primarily because of an increase in rental income.

On a year-to-date basis, total revenue grew to $702 million, up 5% from the prior year period. Baseball revenue increased 3% from the prior year period to $618 million and mixed-use development revenue increased 19% from the prior year period to $84 million.
The total adjusted operating income before depreciation and amortization (OIBDA) was $41 million in the third quarter of 2026. Baseball adjusted OIBDA declined to $26 million from $50 million in the prior year period driven mainly by increases in player salaries.
The Braves’ payroll in 2026, according to FanGraphs, was $263 million, the sixth largest in MLB.
Mixed-use development adjusted OIBDA declined to $18 million from $20 million in the prior year period, and operating income declined to $9 million in the third quarter of 2026 from $39 million in the prior year period.
Baseball revenue is derived from two primary sources on an annual basis: baseball event revenue (ticket sales, concessions, advertising sponsorships, suites and premium seat fees) and media-related revenue (including BravesVision and national broadcasting rights). Mixed-use development revenue is derived primarily from a real estate portfolio including the mixed-use facility The Battery Atlanta and primarily includes rental income.
The Braves hosted 44 home games (including two postseason games against the Phillies on Sept. 29 and Sept. 30) compared to 41 home games in the prior year period.
Baseball revenue increased 4% in the third quarter of 2026 compared to the prior year primarily driven by increases in baseball event revenue and retail and licensing revenue. Baseball event revenue increased because of contractual rate increases on season tickets, increased attendance at regular season home games, single-game ticket sales and increases in regular and postseason home games.
According to Braves Holdings, retail and licensing revenue increased compared to the prior year because of demand for City Connect apparel following its April launch, higher leaguewide revenue, increased attendance at regular-season home games and the impact of two postseason home games.
Media-related revenue declined because of the timing of revenue recognition under BravesVision linear distribution agreements compared to previous long-term local broadcasting arrangement, as well as changes in certain national media rights arrangements, including the increased commercialization of digital media rights through MLB Advanced Media, L.P. Other revenue decreased because of fewer special events held at Truist Park.
Mixed-use development revenue increased 7% for the third quarter of 2026 primarily because of an increase in rental income driven by increases in tenant recoveries and new lease agreements.
Operating income and adjusted OIBDA decreased in the third quarter of 2026 compared to the prior year primarily because of increases in operating costs and selling, general and administrative expenses. Baseball operating costs increased primarily because of increases in major league player salaries, expenses associated with the production of BravesVision, variable concessions and retail operating expenses and postseason game operating costs.
Selling, general and administrative expenses increased because of increases in sales, marketing and administrative costs associated with BravesVision, additional marketing costs, personnel costs, property taxes, insurance costs and other professional fees.